

Press Releases
Inspired Entertainment, Inc. Reports Strong Third Quarter FY2018 Results and Completion of its Debt Refinancing

– Revenue in the third quarter increased 14.3% as compared to the same quarter last year, principally driven by 37.7% growth in Server Based Gaming (“SBG”) service revenue.
– Net loss narrowed significantly, from $8.3 million to $4.0 million, as Adjusted EBITDA(1) increased 60.8% from $9.7 million to $15.5 million.
– Inspired successfully completed an approximately $150.0 million debt refinancing on its senior debt and extended maturity to 2023.(2)
– The Company extended its key contracts with OPAP for video lottery terminals (“VLTs”) and Virtual Sports as well as its server based gaming agreement with Paddy Power.
NEW YORK, Aug, 2018 — Inspired Entertainment, Inc. (“Inspired”) (NASDAQ: INSE) today reported financial results for its third quarter, ended June 30, 2018. As previously announced, management will host a conference call at 8:00 AM U.S. Eastern Time, Tuesday, August 14, 2018, to discuss the third quarter results and general business trends; access details are provided below.
“Our third quarter performance is a testament to the strength of our underlying core business and our ongoing strategy to diversify our revenue base not only across product and service areas but across geographies as well,” said Inspired Executive Chairman Lorne Weil. “With our third quarter Adjusted EBITDA growing 61% year over year to $15.5 million and our Adjusted EBITDA margins growing to 42% from 30%, our business is building as envisioned. Our products continue to deliver and gain traction while our margins are benefiting from scale.”
Mr. Weil continued, “We are very pleased with the additional machine installation and the launch of an additional Virtual Sports channel in Greece. We believe our strong performance in Greece is sparking interest in our innovative games and technology from operators around the world, further diversifying our geographic exposure. We expect this to bode well for our products in North America, where we will be launching Virtual Sports with the Pennsylvania Lottery later this week.”
|
Summary of Consolidated Third Quarter 2018 Financial Results (unaudited) |
||||||
|
Constant |
||||||
|
Qtr Ended |
Currency |
Currency |
||||
|
June 30 |
Change |
Movement |
Growth |
|||
|
2018 |
2017 |
(%) |
2018 |
(%) |
||
|
(In $ millions, except per share figures) |
||||||
|
GAAP Measures: |
||||||
|
Revenue |
$ 36.9 |
$ 32.3 |
14.3% |
$ 2.1 |
7.9% |
|
|
Net Operating Gain (Loss) |
$ 1.6 |
$ (0.7) |
NM2 |
$ 0.1 |
NM |
|
|
Net (loss) |
$ (4.0) |
$ (8.3) |
51.8% |
$ (0.2) |
54.6% |
|
|
Net (loss) per diluted share |
$ (0.19) |
$ (0.41) |
53.7% |
|||
|
Non-GAAP Measures: |
||||||
|
Adjusted EBITDA1 |
$ 15.5 |
$ 9.7 |
60.8% |
$ 0.9 |
51.5% |
|
|
1Reconciliation to GAAP shown below. 2Percentage change is not meaningful. |
||||||
Third Quarter and Recent Highlights
Finance
- Refinancing debt – Inspired announced today the completion of an approximately $150 million refinancing of its borrowing facilities, in a series of transactions, including (i) the sale of $140 million principal amount of five-year promissory notes with a LIBOR + 900 basis points interest rate and (ii) a £7.5 million revolving credit facility. A majority of the net proceeds are being used to prepay Inspired’s existing senior term and revolving credit facility and pay accrued and unpaid interest thereon plus any related premiums, fees and costs. In connection with the refinancing, the Company has entered into a three-year, fixed-rate, cross-currency swap. Details are provided in Inspired’s Current Report on Form 8-K filed with the SEC in respect of the refinancing.
“After the quarter end, we successfully refinanced our senior bank debt and extended our maturity at a lower cost,” said Stewart Baker, Executive Vice President and Chief Financial Officer of Inspired. “This should not only strengthen our balance sheet, it should also lower our cost of capital. Our net debt/Adjusted EBITDA ratio is now 2.5x trailing twelve-month Adjusted EBITDA, which we believe will allow us more flexibility to capitalize on meaningful opportunities to grow our business.”
Server Based Gaming
- Multi-Year Contract Extension and Increased Terminal Order with OPAP – Inspired extended its agreement with Greek betting and lottery operator OPAP to supply VLTs while contracting for an additional 965 terminals, bringing OPAP’s total number of contracted machines to 8,360, with Inspired continuing to have the largest contracted estate in Greece. As of June 30, 2018, Inspired had installed approximately 4,800 terminals in Greece. The revenue per machine of our Greek terminals continued to be strong compared to other suppliers during the period.
- Contract Extension with Paddy Power – The Company extended its agreement with Paddy Power for an additional two and a half years with no further capital expenditure.
- Contract Extension and Increased Revenue Share with Sisal in Italy – Inspired agreed to a four-year contract extension with Sisal Group S.p.A., our largest customer in Italy. In addition to the continuation of hardware, platform and games supply, Inspired will provide service and parts, which comes with an increased revenue share.
- Strong Growth in Italy Estate – Inspired has increased its Customer Gross Win per unit per day in Euros by 21.9% compared to the same period last year, principally driven by new content releases and improved account management.
Virtual Sports
- Launching Pennsylvania Lottery later this week – The Pennsylvania Lottery has been marketing and educating Pennsylvania Lottery retailers and players about Inspired’s Virtual Sports products throughout Pennsylvania. The Lottery is planning to go live with Virtual Sports later this week. Scheduled events will be broadcast on lottery monitors via two dedicated channels, branded Xpress Car Racing™ and Xpress Football™ by the Pennsylvania Lottery.
- Multi-Year Contract Extension and Additional New Virtual Sports Channel with OPAP – Inspired has extended its Virtual Sports agreement with OPAP and will be adding another Virtual Sports channel to launch Football Matchday™ before the end of 2018, alongside Rush Football 2™, which has been offered since April 2017.
- Launch of New Virtual Sports Content with Sisal – Inspired’s Virtual Football Matchday™ is now live and featured on a dedicated channel across 480 of Sisal’s Italian retail estates. This launch makes Inspired the sole provider of Virtual Football content for the leading Italian operator.
- Additional Virtual Sports Operators – Number of Virtual Sports operators increased to 95 live worldwide (as of June 30, 2018), up 15.9% from the same time last year.
- New Mobile Operators Live – By the end of the period, Inspired’s Mobile RGS business was live with 25 customers, having launched Inspired content with 16 new mobile gaming customers since June 30, 2017.
Management Outlook and Commentary
Management expects Adjusted EBITDA to be at the lower end of previously communicated guidance, assuming a fourth quarter GBP:USD exchange rate average of GBP 1 = USD 1.31.
Overview of Third Quarter Results (as compared to third quarter of prior year)
Total revenue for the quarter ended June 30, 2018 increased by $4.6 million, or 14.3%, from the quarter ended June 30, 2017, to $36.9 million, on a reported basis. Favorable currency movements3 accounted for $2.1 million of the increase, with constant currency4 revenue increasing by $2.5 million, or 7.9%.
SBG revenue increased by $2.1 million, or 9.2%, on a constant currency basis, comprised of growth in service revenue of $5.4 million offset by lower hardware sales of $3.2 million.
SBG service revenue increased by $5.4 million, or 30.0%, on a constant currency basis, as a result of the continued rollout of terminals in Greece driving a $1.9 million increase, and software license sales of $3.4 million into Greece.
SBG hardware revenue decreased by $3.2 million, on a constant currency basis, driven by lower hardware sales into Greece of $2.8 million and the Electronic Table Gaming (“ETG”) business of $0.3 million.
Virtual Sports revenue increased by $0.4 million, or 4.5%, on a constant currency basis, to $10.0 million, driven by new customer revenue from Inspired’s Mobile RGS product, as well as continued growth in Greece, Finland and Poland. Underlying Virtual Sports revenue increased by $1.0 million, or 12.8%, with Virtual Sports land-based and online customers accounting for $0.6 million of the increase and $0.4 million coming from Mobile RGS. Growth was negatively affected by $0.6 million due to a reduction in revenue from long-term Virtual Sports licenses that have now come to an end.
Cost of sales, excluding depreciation and amortization, which includes machine cost of sales, consumables, content royalties and connectivity costs, decreased from the quarter ended June 30, 2017 by $1.1 million, or 12.4%, on a reported basis, to $7.9 million. Of this decrease, $0.5 million arose from adverse currency movements. On a constant currency basis, cost of sales decreased by $1.6 million, or 17.4%.
Cost of service increased by $1.4 million, or 32.7%, on a constant currency basis, due to an increase in Greece SBG service costs of $1.1 million, driven by continued roll out, and additional costs to service UK SBG terminals of $0.1 million. The additional cost of supporting new recurring contracts for Virtual Sports amounted to $0.2 million of the increase.
Cost of hardware decreased by $2.9 million, or 59.9%, on a constant currency basis, due to lower nil margin hardware sales in Greece. Hardware sales are made at nil margin in certain circumstances in order to secure long-term revenue sharing contracts.
SG&A expenses increased by $1.5 million, or 10.6%, on a reported basis, to $15.2 million. Of this increase, $0.9 million arose from adverse currency movements. On a constant currency basis, SG&A expenses increased by $0.6 million, or 4.3%. $1.5 million of this adverse variance was due to restructuring costs relating to senior management changes announced in May 2018. This was partially offset by $0.9 million of staff-related cost savings.
Depreciation and amortization increased by $1.9 million, or 22.0%, on a reported basis, to $10.6 million. Of this increase, $0.6 million arose from adverse currency movements. On a constant currency basis, depreciation and amortization increased by $1.3 million, or 14.9%. This increase was driven by $0.6 million of additional amortization in connection with new platforms and games going live on SBG and $0.4 million from machine and machine-related depreciation. This is due to an increase from the continued rollout of machines in Greece ($0.5 million), partly offset by fully depreciated machines in Colombia ($0.1 million).
On a reported basis, our net operating result improved from a loss of $0.7 million in the 2017 period to a profit of $1.6 million in the 2018 period, of which $0.1 million arose from favorable currency movements. On a constant currency basis, net operating loss improved by $2.3 million, due to an increase in revenue and a decrease in cost of sales. This was partly offset by an increase in depreciation and amortization and SG&A.
Adjusted EBITDA, which the Company considers an important underlying business performance measure, increased by 60.8% year over year before adjusting for foreign currency impact. After adjusting for foreign currency impact, Adjusted EBITDA increased 51.5%. Adjusted EBITDA is a non-GAAP financial measure. Our definition of the measure and its reconciliation to net loss are provided later in this release.
|
Operating Segment Review Server Based Gaming Server Based Gaming Key Performance Indicators (KPIs) |
||||||||||||||||
|
(unaudited) |
Three-Month Period Ended |
Variance |
||||||||||||||
|
June 30, |
2018 vs 2017 |
|||||||||||||||
|
2018 |
2017 |
% |
||||||||||||||
|
End of period installed base (# of terminals) |
32,579 |
28,011 |
4,568 |
16.3 |
% |
|||||||||||
|
Average installed base (# of terminals) |
32,107 |
27,569 |
4,538 |
16.5 |
% |
|||||||||||
|
Customer Gross Win per unit per day (1) |
£112.07 |
£118.13 |
£(6.05) |
(5.1) |
% |
|||||||||||
|
Customer Net Win per unit per day (1) |
£79.97 |
£85.13 |
£(5.15) |
(6.1) |
% |
|||||||||||
|
Inspired Blended Participation Rate |
6.0 |
% |
6.0 |
% |
(0.0) |
% |
||||||||||
|
(1) Includes all SBG terminals in which we take a participation revenue share across all territories. |
||||||||||||||||
In the period ended June 30, 2018, SBG revenue increased $3.6 million, to $26.9 million, on a reported basis. Of this increase, $1.5 million arose from favorable currency movements. On a constant currency basis, SBG revenue increased by $2.1 million, or 9.2%.
SBG service revenue increased by $6.7 million, or 37.7%, on a reported basis. Of this increase, $1.4 million arose from favorable currency movements. On a constant currency basis, SBG service revenue increased by $5.4 million, or 30.0%, to $24.5 million, primarily due to the continued rollout of terminals into Greece. This rollout drove additional participation revenue of $1.8 million and other recurring revenue of $0.2 million. During the quarter, we also completed a software license sale into Greece, generating revenue of $3.4 million. SBG service revenue increased on a constant currency basis in Greece and Italy by $5.3 million and $0.2 million, respectively, due to the continued rollout in Greece and growth in Italy. This was partly offset by a decrease in service revenue in other jurisdictions of $0.2 million, due to the revised terms in Colombia following the sale of machines there in 2017.
UK LBO Customer Gross Win per unit per day declined by 0.6%. These decreases were offset by an increase in average live terminals of 988, resulting in UK LBO service revenue in line with the prior period.
SBG hardware revenue decreased by $3.1 million, or 56.3%, to $2.4 million, on a reported basis, including favorable currency movements of $0.1 million. On a constant currency basis, SBG hardware revenue decreased by $3.2 million, principally due to lower hardware sales in Greece (nil margin), the ETG business and Colombia of $2.8 million, $0.3 million and $0.1 million, respectively.
In the quarter ended June 30, 2018, SBG operating profit increased by $2.9 million, or 61.8%, to $7.6 million, on a reported basis, $0.4 million of which arose from favorable currency movements. On a constant currency basis, SBG operating profit increased by $2.5 million.
SBG cost of sales (excluding depreciation and amortization) decreased by $1.4 million, or 16.9%, to $6.7 million, on a reported basis, $0.4 million of which arose from adverse currency movements. On a constant currency basis, cost of sales decreased by $1.7 million. This was principally due to a decrease in hardware costs of $2.9 million due to lower hardware sales in Greece, the ETG business and Colombia. This was partly offset by an increase in service costs of $1.2 million, due to Greek SBG service costs of $1.1 million and additional UK machine consumable costs of $0.1 million.
SBG SG&A expenses increased by $0.1 million, or 2.8%, to $3.8 million, on a reported basis. $0.2 million arose from adverse currency movements, which resulted in a constant currency decrease of $0.3 million.
|
Virtual Sports Virtual Sports Key Performance Indicators (KPIs) |
||||||||
|
(unaudited) |
Three-Month Period ended |
Variance |
||||||
|
June 30, |
2018 vs 2017 |
|||||||
|
Virtuals |
2018 |
2017 |
% |
|||||
|
End of Period # Live Customers |
95 |
82 |
13 |
15.9 % |
||||
|
Average # Live Customers |
93 |
83 |
10 |
11.6 % |
||||
|
Total revenue (£’000) |
£7,339 |
£7,022 |
£317 |
4.5 % |
||||
|
Total revenue (£’000) – Retail |
£4,596 |
£4,555 |
£41 |
0.9 % |
||||
|
Total revenue (£’000) – Interactive |
£2,743 |
£2,467 |
£276 |
11.2 % |
||||
|
Average revenue per customer per day (£) |
£870 |
£930 |
£(59) |
(6.4)% |
||||
Virtual Sports revenue increased $1.0 million, or 10.9%, to $10.0 million on a reported basis. Of this increase, $0.6 million arose from favorable currency movements. On a constant currency basis, Virtual Sports revenue increased by $0.4 million, or 4.5%.
This increase was principally the result of underlying revenue growth of $1.0 million, or 12.8%, with $0.6 million coming from Virtual Sports land-based and online customers driven by increases in Greece, the UK, Finland and Poland of $0.2 million, $0.2 million, $0.2 million and $0.1 million, respectively. The remaining $0.4 million increase from Mobile RGS was driven by further penetration into the mobile marketplace, where the number of our customers increased from nine to 25. These increases were partly offset by a $0.6 million reduction in revenue from long-term licenses that have now come to an end.
Virtual Sports operating profit increased by $0.3 million, or 6.1%, to $5.4 million, on a reported basis. Of this increase, $0.3 million is from favorable currency movement. On a constant currency basis, net operating profit was in line with the prior period.
Virtual Sports cost of service increased by $0.2 million, or 22.2%, to $1.3 million, on a reported basis. Of this increase, $0.1 million arose from adverse currency movements. On a constant currency basis, cost of service increased by $0.2 million due to additional costs of supplying new recurring contracts.
Virtual Sports SG&A expenses increased by $0.6 million, or 46.0%, to $1.8 million, on a reported basis. Of this increase, $0.1 million arose from adverse currency movements, resulting in a constant currency increase of $0.5 million. This was due to an increase in staff-related and technology costs resultant of increasing Virtual Sports deployments.
Non-GAAP Financial Measures
We use certain non-GAAP financial measures, including EBITDA and Adjusted EBITDA, to analyze our operating performance. We use these financial measures to manage our business on a day-to-day basis. We believe that these measures are also commonly used in our industry to measure performance. For these reasons, we believe that these non-GAAP financial measures provide expanded insight into our business, in addition to standard U.S. GAAP financial measures. There are no specific rules or regulations for defining and using non-GAAP financial measures, and as a result the measures we use may not be comparable to measures used by other companies, even if they have similar labels. The presentation of non-GAAP financial information should not be considered in isolation from, or as a substitute for, or superior to, financial information prepared and presented in accordance with U.S. GAAP. You should consider our non-GAAP financial measures in conjunction with our U.S. GAAP financial measures.
We define our non-GAAP financial measures as follows:
EBITDA is defined as net loss excluding depreciation and amortization, interest expense, interest income and income tax expense.
Adjusted EBITDA is defined as net loss excluding depreciation and amortization, interest expense, interest income and income tax expense, and other additional exclusions and adjustments. Such additional excluded amounts include stock-based compensation U.S. GAAP charges where the associated liability is expected to be settled in stock, and changes in the value of earnout liabilities and income and expenditure in relation to legacy portions of the business (being those portions where trading no longer occurs) including closed defined benefit pension schemes. Additional adjustments are made for items considered outside the normal course of business, including (1) restructuring costs, which include charges attributable to employee severance, management changes, restructuring and integration (2) merger and acquisition costs and (3) gains or losses not in the ordinary course of business.
We believe Adjusted EBITDA, when considered along with other performance measures, is a particularly useful performance measure, because it focuses on certain operating drivers of the business, including sales growth, operating costs, selling and administrative expense and other operating income and expense. We believe Adjusted EBITDA can provide a more complete understanding of our operating results and the trends to which we are subject, and an enhanced overall understanding of our financial performance and prospects for the future. Adjusted EBITDA is not intended to be a measure of liquidity or cash flows from operations or a measure comparable to net income or loss, because it does not take into account certain aspects of our operating performance (for example, it excludes non-recurring gains and losses which are not deemed to be a normal part of underlying business activities). Our use of Adjusted EBITDA may not be comparable to the use by other companies of similarly termed measures. Management compensates for these limitations by using Adjusted EBITDA as only one of several measures for evaluating our operating performance. In addition, capital expenditures, which affect depreciation and amortization, interest expense, and income tax benefit (expense), are evaluated separately by management.
Constant Currency. Currency impacts shown have been calculated as the current-period average GBP: USD rate less the equivalent average rate in the prior period, multiplied by the current period amount in our functional currency (GBP). The remaining difference, referred to as constant currency, is calculated as the difference in our functional currency, multiplied by the prior-period average GBP: USD rate, as a proxy for constant currency movement.
Currency Movement represents the difference between the results in our reporting currency (USD) and the results on a Constant Currency basis.
Reconciliations from net loss, as shown in our Consolidated Statements of Operations and Comprehensive Loss included elsewhere in this release, to Adjusted EBITDA are shown below.
Conference Call and Webcast
Inspired management will host a conference call at 8:00 AM U.S. Eastern Time, Tuesday, August 14, 2018, to discuss the Company’s full third quarter FY2018 results and general business trends. The dial-in number is 1-877-870-4263 for participants in the United States and 1-412-317-0790 for participants outside the United States. Participants should ask to be joined to the Inspired Entertainment call. A replay of the call will be available one hour after the conclusion of the call and until August 21, 2018 by calling 1-877-344-7529 for listeners in the United States, or 1-412-317-0088 for listeners outside the United States, via replay access code 10123045. A replay of the call will also be available on our website at www.inseinc.com on the Investors/Events and Presentations web page.
About Inspired Entertainment, Inc.
Inspired is a global games technology company, supplying Virtual Sports, Mobile Gaming and Server Based Gaming systems with associated terminals and digital content to regulated lottery, betting and gaming operators around the world. Inspired currently operates approximately 30,000 digital gaming terminals and supplies its Virtual Sports products through more than 40,000 retail channels and over 100 websites, in approximately 35 gaming jurisdictions worldwide. Inspired employs approximately 800 employees in the UK and elsewhere, developing and operating digital games and networks. Additional information can be found at www.inseinc.com.
Forward Looking Statements
This news release contains “forward-looking statements” within the meaning of the “safe harbor” provisions of the U.S. Private Securities Litigation Reform Act of 1995. Forward-looking statements may be identified by the use of words such as “anticipate”, “believe”, “expect”, “estimate”, “plan”, “outlook”, and “project” and other similar expressions that indicate future events or trends or are not statements of historical matters. These statements are based on our management’s current expectations and beliefs, as well as a number of assumptions concerning future events.
Such forward-looking statements are subject to known and unknown risks, uncertainties, assumptions and other important factors, many of which are outside of our control and all of which could cause actual results to differ materially from the results discussed in the forward-looking statements. Accordingly, forward-looking statements should not be relied upon as representing our views as of any subsequent date, and we do not undertake any obligation to update forward-looking statements to reflect events or circumstances after the date they were made, whether as a result of new information, future events or otherwise, except as may be required under applicable securities laws. Factors that could cause actual results to differ materially from those expressed or implied in forward-looking statements can be found in our reports filed with the Securities and Exchange Commission, including our annual report on Form 10-K, our quarterly reports on Form 10-Q and our current reports on Form 8-K, which are available, free of charge, on the SEC’s website at www.sec.gov and on our site at www.inseinc.com.
Contact:
For Investors
Aimee Remey
[email protected]
+1 646 620-6737
For Press and Sales
|
INSPIRED ENTERTAINMENT, INC. AND SUBSIDIARIES CONDENSED CONSOLIDATED BALANCE SHEETS (in thousands, except share data) |
||||||||
|
June 30, |
September 30, |
|||||||
|
(Unaudited) |
||||||||
|
Assets |
||||||||
|
Current assets |
||||||||
|
Cash |
$ |
10,176 |
$ |
20,028 |
||||
|
Accounts receivable, net |
17,756 |
20,469 |
||||||
|
Inventory, net |
6,417 |
5,011 |
||||||
|
Prepaid expenses and other current assets |
17,117 |
17,692 |
||||||
|
Total current assets |
51,466 |
63,200 |
||||||
|
Property and equipment, net |
46,445 |
43,485 |
||||||
|
Software development costs, net |
45,690 |
46,433 |
||||||
|
Other acquired intangible assets subject to amortization, net |
6,622 |
9,240 |
||||||
|
Goodwill |
46,387 |
47,076 |
||||||
|
Other assets |
10,028 |
9,589 |
||||||
|
Total assets |
$ |
206,638 |
$ |
219,023 |
||||
|
Liabilities and Stockholders’ Deficit |
||||||||
|
Current liabilities |
||||||||
|
Accounts payable |
$ |
20,008 |
$ |
20,407 |
||||
|
Accrued expenses |
12,660 |
18,119 |
||||||
|
Earnout liability |
8,961 |
— |
||||||
|
Corporate tax and other current taxes payable |
2,056 |
3,134 |
||||||
|
Deferred revenue, current |
11,021 |
7,209 |
||||||
|
Other current liabilities |
3,904 |
4,420 |
||||||
|
Current portion of long-term debt |
— |
7,369 |
||||||
|
Current portion of capital lease obligations |
523 |
562 |
||||||
|
Total current liabilities |
59,133 |
61,220 |
||||||
|
Long-term debt |
127,923 |
115,396 |
||||||
|
Capital lease obligations, net of current portion |
133 |
532 |
||||||
|
Deferred revenue, net of current portion |
22,678 |
20,144 |
||||||
|
Earnout liability, net of current portion |
— |
16,728 |
||||||
|
Derivative liability |
— |
964 |
||||||
|
Other long-term liabilities |
1,760 |
6,368 |
||||||
|
Total liabilities |
211,627 |
221,352 |
||||||
|
Commitments and contingencies |
||||||||
|
Stockholders’ deficit |
||||||||
|
Preferred stock; $0.0001 par value; 1,000,000 shares authorized |
— |
— |
||||||
|
Series A Junior Participating Preferred stock; $0.0001 par value; 1,000,000 shares authorized; |
— |
— |
||||||
|
Common stock; $0.0001 par value; 49,000,000 shares authorized; 20,860,591 shares and |
2 |
2 |
||||||
|
Additional paid in capital |
326,967 |
323,429 |
||||||
|
Accumulated other comprehensive income |
55,619 |
53,145 |
||||||
|
Accumulated deficit |
(387,577) |
(378,905) |
||||||
|
Total stockholders’ deficit |
(4,989) |
(2,329) |
||||||
|
Total liabilities and stockholders’ deficit |
$ |
206,638 |
$ |
219,023 |
||||
|
INSPIRED ENTERTAINMENT, INC. AND SUBSIDIARIES CONDENSED CONSOLIDATED STATEMENTS OF OPERATIONS AND COMPREHENSIVE LOSS (in thousands, except share data) (Unaudited) |
||||||||||||||||
|
Three Months Ended June 30, |
Nine Months Ended June 30, |
|||||||||||||||
|
2018 |
2017 |
2018 |
2017 |
|||||||||||||
|
Revenue: |
||||||||||||||||
|
Service |
$ |
34,536 |
$ |
26,838 |
$ |
98,136 |
$ |
77,478 |
||||||||
|
Hardware |
2,390 |
5,473 |
7,630 |
9,930 |
||||||||||||
|
Total revenue |
36,926 |
32,311 |
105,766 |
87,408 |
||||||||||||
|
Cost of sales, excluding depreciation and amortization: |
||||||||||||||||
|
Cost of service |
(5,862) |
(4,166) |
(17,075) |
(11,146) |
||||||||||||
|
Cost of hardware |
(2,085) |
(4,908) |
(7,058) |
(8,520) |
||||||||||||
|
Selling, general and administrative expenses |
(15,245) |
(13,786) |
(47,241) |
(41,922) |
||||||||||||
|
Stock-based compensation expense |
(1,485) |
(1,377) |
(5,934) |
(2,703) |
||||||||||||
|
Acquisition related transaction expenses |
(14) |
(74) |
(816) |
(11,346) |
||||||||||||
|
Depreciation and amortization |
(10,616) |
(8,705) |
(31,296) |
(23,877) |
||||||||||||
|
Net operating income (loss) |
1,619 |
(705) |
(3,654) |
(12,106) |
||||||||||||
|
Other income (expense) |
||||||||||||||||
|
Interest income |
36 |
8 |
167 |
20 |
||||||||||||
|
Interest expense |
(5,185) |
(5,013) |
(15,253) |
(23,978) |
||||||||||||
|
Change in fair value of earnout liability |
(644) |
(2,384) |
7,767 |
(3,262) |
||||||||||||
|
Change in fair value of derivative liability |
— |
(270) |
1,872 |
(349) |
||||||||||||
|
Other finance income (costs) |
194 |
(55) |
584 |
(162) |
||||||||||||
|
Total other income (expense), net |
(5,599) |
(7,714) |
(4,863) |
(27,731) |
||||||||||||
|
Net loss before income taxes |
(3,980) |
(8,419) |
(8,517) |
(39,837) |
||||||||||||
|
Income tax benefit (expense) |
(39) |
86 |
(155) |
3 |
||||||||||||
|
Net loss |
(4,019) |
(8,333) |
(8,672) |
(39,834) |
||||||||||||
|
Other comprehensive income (loss): |
||||||||||||||||
|
Foreign currency translation (loss) gain |
(188) |
(569) |
234 |
17,565 |
||||||||||||
|
Actuarial gains (losses) on pension plan |
2,984 |
(1,611) |
2,240 |
(4,734) |
||||||||||||
|
Other comprehensive income/(loss) |
2,796 |
(2,180) |
2,474 |
12,831 |
||||||||||||
|
Comprehensive loss |
$ |
(1,223) |
$ |
(10,513) |
$ |
(6,198) |
$ |
(27,003) |
||||||||
|
Net loss per common share – basic and diluted |
$ |
(0.19) |
$ |
(0.41) |
$ |
(0.42) |
$ |
(2.26) |
||||||||
|
Weighted average number of shares outstanding |
20,860,591 |
20,378,002 |
20,718,682 |
17,607,808 |
||||||||||||
|
INSPIRED ENTERTAINMENT, INC. AND SUBSIDIARIES CONDENSED CONSOLIDATED STATEMENTS OF STOCKHOLDERS’ EQUITY (DEFICIT) (in thousands, except share data) (Unaudited) |
||||||||||||||||||||||||
|
Common stock |
Additional |
Accumulated |
Accumulated |
Total |
||||||||||||||||||||
|
Shares |
Amount |
capital |
income |
deficit |
deficit |
|||||||||||||||||||
|
Balance at October 1, 2017 |
20,402,602 |
$ |
2 |
$ |
323,429 |
$ |
53,145 |
$ |
(378,905) |
$ |
(2,329) |
|||||||||||||
|
Foreign currency translation adjustments |
— |
— |
— |
234 |
— |
234 |
||||||||||||||||||
|
Actuarial gains on pension plan |
— |
— |
— |
2,240 |
— |
2,240 |
||||||||||||||||||
|
Shares issued on exercise of warrants |
50 |
— |
1 |
— |
— |
1 |
||||||||||||||||||
|
Shares issued upon net settlement of RSUs and RSAs |
457,939 |
— |
(1,043) |
— |
— |
(1,043) |
||||||||||||||||||
|
Stock-based compensation expense |
— |
— |
3,214 |
— |
— |
3,214 |
||||||||||||||||||
|
Reclassification of RSUs from derivative liability due to |
— |
— |
2,848 |
— |
— |
2,848 |
||||||||||||||||||
|
Reclassification of RSUs to derivative liability due to |
— |
— |
(1,482) |
— |
— |
(1,482) |
||||||||||||||||||
|
Net loss |
— |
— |
— |
— |
(8,672) |
(8,672) |
||||||||||||||||||
|
Balance at June 30, 2018 |
20,860,591 |
$ |
2 |
$ |
326,967 |
$ |
55,619 |
$ |
(387,577) |
$ |
(4,989) |
|||||||||||||
|
INSPIRED ENTERTAINMENT, INC. AND SUBSIDIARIES CONDENSED CONSOLIDATED STATEMENTS OF CASH FLOWS (in thousands) (Unaudited) |
||||||||
|
Nine Months Ended June 30, |
||||||||
|
2018 |
2017 |
|||||||
|
Cash flows from operating activities: |
||||||||
|
Net loss |
$ |
(8,672) |
$ |
(39,834) |
||||
|
Adjustments to reconcile net loss to net cash provided by operating activities: |
||||||||
|
Depreciation and amortization |
31,296 |
23,877 |
||||||
|
Stock-based compensation expense |
5,625 |
2,703 |
||||||
|
Change in fair value of derivative liability |
(1,872) |
349 |
||||||
|
Change in fair value of earnout liability |
(7,767) |
3,262 |
||||||
|
Non-cash interest expense relating to senior debt |
5,824 |
— |
||||||
|
Non-cash interest expense relating to PIK loan notes |
— |
9,762 |
||||||
|
Changes in assets and liabilities: |
||||||||
|
Accounts receivable |
2,392 |
1,470 |
||||||
|
Inventory |
(1,569) |
3,029 |
||||||
|
Prepaid expenses and other assets |
1,061 |
(3,976) |
||||||
|
Corporate tax and other current taxes payable |
(1,883) |
(926) |
||||||
|
Accounts payable |
(4,126) |
4,790 |
||||||
|
Other current liabilities |
(69) |
(11) |
||||||
|
Deferred revenues and customer prepayment |
6,807 |
2,931 |
||||||
|
Accrued expenses |
(5,274) |
(703) |
||||||
|
Other long-term liabilities |
(4,004) |
(2,524) |
||||||
|
Net cash provided by operating activities |
17,769 |
4,199 |
||||||
|
Cash flows from investing activities: |
||||||||
|
Purchases of property and equipment |
(14,914) |
(12,761) |
||||||
|
Purchases of capital software |
(13,228) |
(16,304) |
||||||
|
Net cash used in investing activities |
(28,142) |
(29,065) |
||||||
|
Cash flows from financing activities: |
||||||||
|
Proceeds from issuance of revolver and long-term debt |
9,290 |
5,732 |
||||||
|
Cash received in connection with Merger |
— |
36,664 |
||||||
|
Proceeds from sale of common stock |
— |
1,645 |
||||||
|
Repayments of long-term debt |
(7,713) |
— |
||||||
|
Repayments of finance leases |
(438) |
(91) |
||||||
|
Net cash provided by financing activities |
1,139 |
43,950 |
||||||
|
Effect of exchange rate changes on cash |
(618) |
2,130 |
||||||
|
Net (decrease) increase in cash |
(9,852) |
21,214 |
||||||
|
Cash, beginning of period |
20,028 |
1,486 |
||||||
|
Cash, end of period |
$ |
10,176 |
$ |
22,700 |
||||
|
Supplemental cash flow disclosures |
||||||||
|
Cash paid during the period for interest |
$ |
12,483 |
$ |
10,362 |
||||
|
Cash paid during the period for income taxes |
$ |
7 |
$ |
66 |
||||
|
Supplemental disclosure of noncash investing and financing activities |
||||||||
|
Additional paid in capital from net settlement of RSUs |
$ |
(1,043) |
$ |
— |
||||
|
Additional paid in capital reclassified to derivative liability |
$ |
(1,482) |
$ |
— |
||||
|
Additional paid in capital reclassified from derivative liability |
$ |
2,848 |
$ |
— |
||||
|
Derivative liability reclassified to accrued expenses |
$ |
126 |
$ |
— |
||||
|
Fair value adjustment of PIK shareholder loans |
$ |
— |
$ |
174,990 |
||||
|
Property acquired through capital lease |
$ |
— |
$ |
1,208 |
||||
|
INSPIRED ENTERTAINMENT, INC. AND SUBSIDIARIES CONDENSED CONSOLIDATED STATEMENT OF OPERATIONS RECONCILIATION OF NON-GAAP FINANCIAL MEASURES (in thousands) (Unaudited) |
|||||
|
For the Three-Month Period ended |
|||||
|
Unaudited |
Unaudited |
||||
|
(In thousands) |
2018 |
2017 |
|||
|
Net loss |
($4,019) |
($8,333) |
|||
|
Items Relating to Legacy Activities: |
|||||
|
Pension charges |
135 |
177 |
|||
|
Costs relating to former operations |
3 |
– |
|||
|
Items outside the normal course of business: |
|||||
|
Costs of group restructure |
1,655 |
29 |
|||
|
Transaction fees |
14 |
73 |
|||
|
Stock-based compensation expense |
1,485 |
1,377 |
|||
|
Depreciation and amortization |
10,616 |
8,705 |
|||
|
Total other expense, net |
5,599 |
7,714 |
|||
|
Income tax |
39 |
(86) |
|||
|
Adjusted EBITDA |
$15,526 |
$9,656 |
|||
|
Adjusted EBITDA |
£11,411 |
£7,531 |
|||
|
Exchange Rate – $ to £ |
1.36 |
1.28 |
|||
|
INSPIRED ENTERTAINMENT, INC. SEGMENT PERFORMANCE (in thousands) (Unaudited) |
||||||||||||||||
|
Three Months Ended June 30, 2018 |
||||||||||||||||
|
Server Based |
Virtual |
Corporate |
Total |
|||||||||||||
|
Revenue: |
||||||||||||||||
|
Service |
$ |
24,549 |
$ |
9,987 |
$ |
— |
$ |
34,536 |
||||||||
|
Hardware |
2,390 |
— |
— |
2,390 |
||||||||||||
|
Total revenue |
26,939 |
9,987 |
— |
36,926 |
||||||||||||
|
Cost of sales, excluding depreciation and amortization: |
||||||||||||||||
|
Cost of service |
(4,582) |
(1,280) |
— |
(5,862) |
||||||||||||
|
Cost of hardware |
(2,085) |
— |
— |
(2,085) |
||||||||||||
|
Selling, general and administrative expenses |
(3,802) |
(1,784) |
(9,659) |
(15,245) |
||||||||||||
|
Stock-based compensation expense |
(65) |
(72) |
(1,348) |
(1,485) |
||||||||||||
|
Acquisition related transaction expenses |
— |
— |
(14) |
(14) |
||||||||||||
|
Depreciation and amortization |
(8,829) |
(1,456) |
(331) |
(10,616) |
||||||||||||
|
Segment operating income (loss) |
7,576 |
5,395 |
(11,352) |
1,619 |
||||||||||||
|
Net operating gain |
$ |
1,619 |
||||||||||||||
|
Total assets at June 30, 2018 |
$ |
117,022 |
$ |
72,163 |
$ |
17,453 |
$ |
206,638 |
||||||||
|
Total goodwill at June 30, 2018 |
$ |
— |
$ |
46,387 |
$ |
— |
$ |
46,387 |
||||||||
|
Total capital expenditures for the three months ended June 30, 2018 |
$ |
11,909 |
$ |
2,175 |
$ |
— |
$ |
14,084 |
||||||||
|
Three Months Ended June 30, 2017 |
||||||||||||||||
|
Server Based |
Virtual |
Corporate |
Total |
|||||||||||||
|
Revenue: |
||||||||||||||||
|
Service |
$ |
17,834 |
$ |
9,004 |
$ |
— |
$ |
26,838 |
||||||||
|
Hardware |
5,473 |
— |
— |
5,473 |
||||||||||||
|
Total revenue |
23,307 |
9,004 |
— |
32,311 |
||||||||||||
|
Cost of sales, excluding depreciation and amortization: |
||||||||||||||||
|
Cost of service |
(3,119) |
(1,047) |
— |
(4,166) |
||||||||||||
|
Cost of hardware |
(4,908) |
— |
— |
(4,908) |
||||||||||||
|
Selling, general and administrative expenses |
(3,912) |
(1,222) |
(8,652) |
(13,786) |
||||||||||||
|
Stock-based compensation expense |
(65) |
(79) |
(1,233) |
(1,377) |
||||||||||||
|
Acquisition related transaction expenses |
— |
— |
(74) |
(74) |
||||||||||||
|
Depreciation and amortization |
(6,622) |
(1,570) |
(513) |
(8,705) |
||||||||||||
|
Segment operating income (loss) |
4,681 |
5,086 |
(10,472) |
(705) |
||||||||||||
|
Net operating loss |
$ |
(705) |
||||||||||||||
|
Total assets at September 30, 2017 |
$ |
113,692 |
$ |
75,975 |
$ |
29,356 |
$ |
219,023 |
||||||||
|
Total goodwill at September 30, 2017 |
$ |
— |
$ |
47,076 |
$ |
— |
$ |
47,076 |
||||||||
|
Total capital expenditures for the three months ended June 30, 2017 |
$ |
7,558 |
$ |
2,016 |
$ |
415 |
$ |
9,989 |
||||||||
|
1 Adjusted EBITDA is a non-GAAP financial measure. Our definition of the measure and its reconciliation to net loss are provided later in this release. |
|
2 Inspired simultaneously executed a cross-currency swap that established an effective fixed rate funding cost. See Inspired’s Current Report on Form 8-K files with the SEC in respect of the refinancing. |
|
3 Currency movement is a non-GAAP financial measure. See “Non-GAAP Financial Measures” below for definition. |
|
4 Adjusted to remove differences due to currency changes. See “Non-GAAP Financial Measures” below for definition. |
Source: Inspired Entertainment, Inc.


Wazdan, the gain-focused developer behind some of the world’s most rewarding casino game experiences has further expanded in the regulated Swiss market, taking its games live with Swiss4Win.
The collaboration enhances Wazdan’s profile in the country with Swiss4Win’s leading online gambling platform revolutionising player experiences with the introduction of the studio’s exciting range of games.
As Wazdan continues to deliver the world’s most rewarding casino game experiences, this new partnership heralds a new era of entertainment. Players can look forward to a diverse selection of captivating slots designed to appeal to Swiss players.
In conjunction with this partnership, Swiss4Win unveils its new website, meticulously crafted to enhance user engagement. The platform boasts a cutting-edge SEO-oriented design, complemented by a sleek dark mode interface. With a heightened focus on slot providers, the website features a dedicated page showcasing premier gaming offerings.
Radka Bacheva, Head of Sales and Business Development at Wazdan, said: “We’re excited to join forces with swiss4win.ch to introduce our latest games to players worldwide. This collaboration represents a shared commitment to innovation and excellence in the iGaming industry.”
Paolo Sanvido, Chief Executive Officer at Casino Lugano and Swiss4Win, added: “Wazdan’s distinguished reputation stems from its exceptional graphics and innovative features, which have resonated with players globally. Its dedication to crafting enriching casino experiences offers players greater control over their gaming preferences and seamlessly aligns with our audience’s interests.”
- Revenue for the 1st quarter of 710 million euros, up 7%
- Gaming revenue[1] in France of 645 million euros, up 3% on a high basis of comparison in the 1st quarter of 2023
- Strong momentum in online games, with revenue of 100 million euros, representing almost 15% of the Group’s total gaming revenue
- Tender offer for Kindred opened on 20 February 2024 for a maximum period of 9 months
- The completion of the tender offer remains subject, in particular, to obtaining regulatory approvals and to FDJ acquiring at least 90% of Kindred’s share capital
La Française des Jeux (FDJ), France’s leading gaming operator, has announced its revenue for the 1st quarter of 2024.
Stéphane Pallez, Chairwoman and CEO of the FDJ Group, said: “FDJ has made a good start to the year, in line with its 2024 objectives. All our activities are growing, thanks to our network of over 29,000 retailers and a dynamic online gaming business, which now accounts for 15% of the Group’s gaming revenue. We are also confidently pressing ahead with the Kindred acquisition announced at the end of January.”
Highlights of the 1st quarter of 2024
- Revenue up 7% to 710 million euros
|
Q1 2024 €m |
Q1 2023 €m |
Change in % |
of which change on a like-for-like basis
% |
|
| Lottery | 504 | 497 | +1.4% | +1.4% |
| Sports betting and competitive
online gaming |
141 | 129 | +9.5% | +0.9% |
| Other activities | 65 | 37 | +77.4% | -3.7% |
| Group total | 710 | 662 | +7.2% | +1.1% |
Revenue for the 1st quarter of 2024 came to 710 million euros, up 7.2% and 1.1% on a like-for-like basis, a performance in line with Group projections.
- Gaming revenue in France rose by 3.1% to 645 million euros.
- Lottery revenue rose by 1.4% to 504 million euros, driven by over 4% growth in instant games, driven by the success of gaming portfolio animation such as the launch of Ticket d’Or (€5) at the beginning of January. Draw games, as expected given the unfavourable base effect, mainly for Amigo, were down by 3%. Excluding Amigo, which decline is attributable to its new formula launched at the beginning of June 2023 has stabilised, lottery revenue would have grown by more than 4%.
- In sports betting & online gaming open to competition, revenue came to 141 million euros, up 9.5% and up 0.9% excluding the integration of ZEturf, despite a high basis for comparison in the 1st quarter of 2023, which had benefited in particular from the very positive impact of the World Cup at the end of 2022.
This performance is attributable to the strong growth in revenue of ParionsSport En Ligne, which rose by more than 25%; which, in addition to its intrinsic momentum, also benefits from the attractiveness of poker, with a high level of cross-selling.
- Revenue from other activities (International and Payment & Services) came to 65 million euros, compared with 37 million euros in the 1st quarter of 2023, an increase attributable to the integration of PLI, which performed well, driven in particular thanks to EuroDreams.
- The momentum of online games remains very strong, with revenue up by more than 30% to 100 million euros, representing almost 15% of the Group’s total gaming revenue. Excluding ZEturf and PLI, growth in online games revenue exceeded 20%, driven both by sports betting and online gaming open to competition and by the online lottery, which benefited from EuroDreams’ very high rate of digitalisation, as well as from the attractiveness of instant games and of the exclusive online offer.
- Tender offer for Kindred
- On 20 February 2024, the tender offer for Kindred was opened for a maximum period of 39 weeks. Its completion remains subject, in particular, to obtaining regulatory approvals and to FDJ acquiring at least 90% of Kindred’s share capital.
- On 15 March 2024, Kindred’s shareholders at an Extraordinary General Meeting approved an amendment to the Articles of Association to allow a squeeze-out procedure to be implemented by any shareholder holding at least 90% of Kindred’s share capital.
- On 28 March 2024, following Veralda’s offer to sell 49% of its Kindred shares, i.e. 2.4 million shares corresponding to 1.12% of the outstanding shares, at a price of SEK122.5 per share, FDJ decided to exercise its right of pre-emption linked to Veralda’s irrevocable commitment, communicated when the transaction with Kindred was announced on 22 January 2024.
As a result, FDJ acquired 2.4 million Kindred shares for SEK 294 million (€25.8 million) and Veralda’s irrevocable commitment continues to apply to its remaining 1.18% stake in Kindred. FDJ now holds 1.12% of Kindred’s outstanding shares and the irrevocable commitments (Corvex Management LP, Premier Investissement SAS, Eminence Capital, Nordea and Veralda) now represent 26.82% of Kindred’s outstanding shares.
Annual General Meeting
FDJ’s Annual General Meeting will be held on Thursday 25 April 2024 at 14.30 at the Palais des Congrès in Issy-les-Moulineaux (25, avenue Victor Cresson – 92130
Issy-les-Moulineaux).
On this occasion, the Group will propose a dividend of 1.78 euro per share in respect of the 2023 financial year, to be paid on 7 May 2024.
Next financial communication
FDJ will publish its half-year results on Thursday 25 July 2024 after the close of trading.
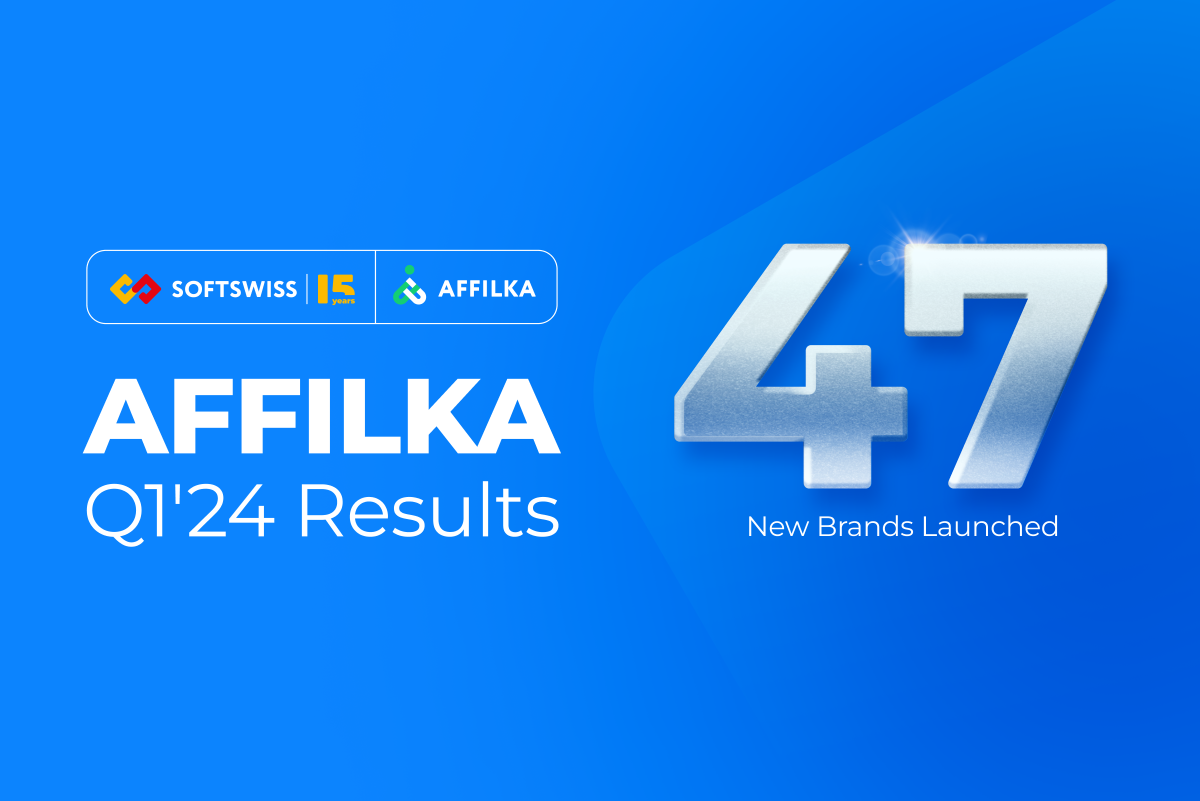
Affilka by SOFTSWISS, a leading affiliate management software provider, is approaching a new milestone of 360 brands in Q1’24.
The first quarter of the year brought remarkable achievements to the Affilka by SOFTSWISS team. The Asian gaming community recognised the company’s affiliate management software as the Best Affiliate Marketing Solution on the market.
This year, Affilka’s team participated in iGB Affiliate London 2024 with a dedicated stand for the first time. During the concurrent iGB and ICE events, the team had nearly 200 meetings over several days. First agreements quickly followed and were signed shortly after the exhibition period.
Affilka by SOFTSWISS experienced substantial growth, adding 47 new brands to its partner network, bringing the total to nearly 360 brands in Q1 2024. More than 33 thousand new affiliate accounts were registered during this period, marking a 118% increase compared to the previous year’s last quarter.

The rise in new affiliate accounts has led to an acceleration in new player registrations, exceeding 7.4 million over the first quarter of the year. Compared to the last quarter of 2023, this metric demonstrated a 106% increase.
The number of unique clicks on referral links with Affilka by SOFTSWISS during this period showed 115% growth and reached almost 436 million in absolute numbers. The rising metrics underscore the crucial role of effective affiliate management in achieving success within the iGaming industry.

Moving to the financial metrics of Affilka by SOFTSWISS, stable growth is evident over the first quarter of 2024 compared to the last quarter of 2023. The affiliate GGR revealed a 112% increase, while the player deposit amount showed a 113% enlargement. The growth within affiliate payments amounted to 117% in Q1’24 compared to the previous quarter.
Anastasia Borovaya, Head of Affilka by SOFTSWISS, summarises: “The recent product performance showcases a steady and continuous growth trajectory, a testament to our ongoing investment in innovation and user experience enhancement. Acknowledging affiliate marketing’s crucial role in the iGaming ecosystem, we prioritise delivering exceptional service to exceed our clients’ expectations.”
The global affiliate marketing industry is expected to double in size within the next five years. Finding a reliable affiliate marketing platform provider ensures a competitive edge in the rapidly expanding market.
The team is ready to share valuable industry insights and unveil the upcoming updates at the SiGMA Americas Summit in San Paulo on 23–25 April. Clients and potential partners can book a meeting with the Affilka team at stand i70 on the SOFTSWISS events page.
About SOFTSWISS
SOFTSWISS is an international tech company supplying software solutions for managing iGaming projects. The expert team, which counts over 2,000 employees, is based in Malta, Poland, and Georgia. SOFTSWISS holds a number of gaming licences and provides one-stop-shop iGaming software solutions. The company has a vast product portfolio, including the Online Casino Platform, the Game Aggregator with thousands of casino games, the Affilka affiliate platform, the Sportsbook Platform and the Jackpot Aggregator. In 2013, SOFTSWISS was the first in the world to introduce a Bitcoin-optimised online casino solution.


The MAC Europe Partner Marketing Conference is back!

Wazdan amplifies Swiss presence with Swiss4Win launch

WhichBingo Reveals 2024 Award Winners at 10th Anniversary of the WhichBingo Awards

Bet365 Debuts its Bespoke Live Game Show Super Mega Ultra in Collaboration with Playtech

Aleatrust Signs Up as Supporting Member of the Austrian Sports Betting Association

Good 1st quarter of 2024 for FDJ, in line with Group projections

47 New Brands in Q1’24: Affilka by SOFTSWISS Results

Clarion Gaming film Virtual Tour showing scale of opportunity for ICE and iGB Affiliate exhibitors in Barcelona

1Stop Translations Partners with Suss Ads

GiG bags a brace of deals for Spain and Argentina, with two new partners for its iGaming platform CoreX and Sportsbook, SportX

2024 Gaming in Spain Conference

HIPTHER’s Prague Gaming & TECH Summit 2024 reaches new milestones with record registrations and prominent sponsors

IGT Announces Executive and Board Leadership Changes

HIPTHER’s Prague Gaming & TECH Summit 2024 Boasts All-star Sponsors and Record Registrations

Meet GR8 Tech at the Prague Gaming & TECH Summit on March 26-27

The Nomination Committee’s Proposal of Catena Media’s Board of Directors at the Annual General Meeting 2024
-

 Conferences in Europe7 days ago
Spanish Advertising Restrictions Struck Down: Learn More at the 2024 Gaming in Spain Conference
-
Balkans7 days ago
Making a Bang in Bulgaria! Hacksaw Gaming goes live with Alphawin
-
eSports7 days ago
Copenhagen Major 2024 – Betting Overview
-
Compliance Updates7 days ago
IOC and UEFA host joint betting integrity workshop
-
Latest News7 days ago
Week 15/2024 slot games releases
-
Gaming7 days ago
Sortium Revolutionizing Video Game Development with Groundbreaking AI Tools Launch and $4 Million+ Funding Round
-
Latest News7 days ago
CasinoBeats Game Developer Awards 2024 Shortlists Announced
-
Compliance Updates4 days ago
Bet on Compliance: Navigating the Stakes with the UK’s Affordability Checks


