

Industry News
Las Vegas Sands Reports Third Quarter 2018 Results

For the Quarter Ended September 30, 2018
(Compared to the Quarter Ended September 30, 2017)
– Consolidated Net Revenue Increased 6.7% to $3.37 Billion
– Net Income Increased 2.2% to $699 Million
– GAAP Earnings per Diluted Share Increased 1.4% to $0.73; Adjusted Earnings per Diluted Share Was $0.77
– Consolidated Adjusted Property EBITDA Increased 6.0% to $1.28 Billion, While Hold-Normalized Adjusted Property EBITDA Increased 7.5% to $1.27 Billion
– In Macao, Adjusted Property EBITDA Increased 15.8% to $754 Million, While Hold-Normalized Adjusted Property EBITDA Increased 17.6% to $754 Million
– At Marina Bay Sands in Singapore, Adjusted Property EBITDA Was $419 Million
– At Our Las Vegas Operating Properties, Adjusted Property EBITDA Was $76 Million, While Hold-Normalized Adjusted Property EBITDA Increased 7.8% to $97 Million
– The Company Paid Quarterly Dividends of $0.75 per Share
– The Company Repurchased $300 Million of Common Stock During the Quarter
– The Company’s Board of Directors Announced an $0.08 Increase in the Company’s Recurring Common Stock Dividend for the 2019 Calendar Year, its Seventh Consecutive Annual Increase, Raising the Annual Dividend to $3.08 ($0.77 per Share per Quarter)
Las Vegas Sands Corp. (NYSE: LVS), the world’s leading developer and operator of convention-based Integrated Resorts, reported financial results for the quarter ended September 30, 2018.
Third Quarter Overview
Mr. Sheldon G. Adelson, chairman and chief executive officer, said, “We are pleased to have delivered strong financial results in the quarter, led by continued growth in every market segment in Macao. Our Integrated Resort property portfolio in Macao delivered adjusted property EBITDA of $754 million, an increase of 15.8% compared to the third quarter of 2017. At Marina Bay Sands in Singapore, our hotel, retail, convention and mass gaming segments all exhibited strength, contributing to $419 million of adjusted property EBITDA for the quarter.
“We also continued to invest in growth initiatives in each of our markets. We remain supremely confident in the future opportunity in Macao, and have therefore elected to meaningfully increase the scale of our investments in the Four Seasons Tower Suites Macao, St. Regis Tower Suites Macao and The Londoner Macao, which will now total $2.2 billion in investment through 2021. We believe our market-leading interconnected Integrated Resort portfolio in Macao, including the additional destination retail, luxurious hotel suite offerings and world class entertainment attractions of the Four Seasons Tower Suites Macao, St. Regis Tower Suites Macao and The Londoner Macao, will provide an ideal platform for growth in Macao in the years ahead.
“In addition, we announced an increase in our annual dividend for the 2019 calendar year to $3.08, or $0.77 per share per quarter, and increased our return of capital through share repurchases of $300 million during the quarter.”
The company paid a recurring quarterly dividend of $0.75 per common share during the quarter. The company announced its next quarterly dividend of $0.75 per common share will be paid on December 27, 2018, to Las Vegas Sands shareholders of record on December 18, 2018.
Company-Wide Operating Results
Net revenue for the third quarter of 2018 increased 6.7% to $3.37 billion, compared to $3.16 billion in the third quarter of 2017. Net income increased 2.2% to $699 million in the third quarter of 2018, compared to $684 million in the year-ago quarter.
Effective January 1, 2018, the Company adopted the new revenue recognition standard on a full retrospective basis. The adoption of this standard did not have a material impact on the Company’s financial condition or net income. All 2017 financial results have been revised to conform to the current presentation.
On a GAAP (accounting principles generally accepted in the United States of America) basis, operating income in the third quarter of 2018 increased 7.8% to $922 million, compared to $855 million in the third quarter of 2017. The increase in operating income was primarily due to stronger operating performance in our Macao business due to a 13% increase in revenues, offset by softer Rolling Chip volume in Singapore. Consolidated adjusted property EBITDA (a non-GAAP measure) of $1.28 billion increased 6.0% in the third quarter of 2018, compared to the year-ago quarter. On a hold-normalized basis, consolidated adjusted property EBITDA increased 7.5% to $1.27 billion in the third quarter of 2018.
On a GAAP basis, net income attributable to Las Vegas Sands in the third quarter of 2018 increased to $571 million, compared to $569 million in the third quarter of 2017, while diluted earnings per share in the third quarter of 2018 of $0.73 represented an increase of 1.4% compared to the prior-year quarter. The favorable operating factors described above were partially offset by the loss recognized upon the early retirement of debt in connection with the unsecured notes issued by Sands China Ltd. (SCL) and an increase in the net income attributable to noncontrolling interests.
Adjusted net income attributable to Las Vegas Sands (a non-GAAP measure) was $604 million, or $0.77 per diluted share, compared to $606 million, or $0.77 per diluted share, in the third quarter of 2017. Hold-normalized adjusted earnings per diluted share increased 2.7% to $0.75.
Sands China Ltd. Consolidated Financial Results
On a GAAP basis, total net revenues for SCL increased 13% to $2.15 billion in the third quarter of 2018, compared to $1.90 billion in the third quarter of 2017. Net income for SCL increased 13% to $454 million in the third quarter of 2018, compared to $403 million in the third quarter of 2017.
Other Factors Affecting Earnings
Depreciation and amortization expense was $284 million in the third quarter of 2018, compared to $265 million in the third quarter of 2017.
Interest expense, net of amounts capitalized, was $126 million for the third quarter of 2018, compared to $83 million in the prior-year quarter. Our weighted average borrowing cost in the third quarter of 2018 was approximately 4.2%, compared to 3.2% during the third quarter of 2017. We incurred a loss on early retirement of debt of $52 million during the third quarter of 2018. This loss and the increases in interest expense and net weighted average borrowing cost relate to the issuance of unsecured notes by SCL, as further described below.
Other income, which was comprised primarily of foreign currency gains, was $16 million for the third quarter of 2018, compared to other expense of $19 million in the third quarter of 2017.
Our effective income tax rate for the third quarter of 2018 was 10.6% compared to 9.6% in the prior-year quarter. The tax rate for the third quarter of 2018 is primarily driven by a provision for the earnings from Marina Bay Sands at the 17% Singapore income tax rate and a provision for our domestic earnings at the 21% corporate income tax rate based on the Tax Cuts and Jobs Act (the “Act”). The Act creates complexity that will likely require implementation guidance from the Internal Revenue Service and could impact our tax return filing positions, which may impact the estimates and assumptions utilized in our initial analysis.
The net income attributable to noncontrolling interests during the third quarter of 2018 increased to $128 million and was principally related to SCL.
Balance Sheet Items
Unrestricted cash balances as of September 30, 2018 were $4.77 billion.
As of September 30, 2018, total debt outstanding, including the current portion and net of deferred financing costs and original issue discount, was $11.98 billion.
On August 9, 2018, SCL issued, in a private offering, three series of senior unsecured notes in an aggregate principal amount of $5.50 billion, consisting of $1.80 billion of 4.600% Senior Notes due August 8, 2023, $1.80 billion of 5.125% Senior Notes due August 8, 2025 and $1.90 billion of 5.400% Senior Notes due August 8, 2028. A portion of the net proceeds from the offering was used to repay in full the outstanding borrowings under the 2016 VML Credit Facility.
Capital Expenditures
Capital expenditures during the third quarter totaled $207 million, including construction, development and maintenance activities of $131 million in Macao, $26 million in Las Vegas, $44 million at Marina Bay Sands and $6 million at Sands Bethlehem.
Conference Call Information
The company will host a conference call to discuss the company’s results on Wednesday, October 24, 2018 at 1:30 p.m. Pacific Time. Interested parties may listen to the conference call through a webcast available on the company’s website at www.sands.com.
Forward-Looking Statements
This press release contains forward-looking statements that are made pursuant to the Safe Harbor Provisions of the Private Securities Litigation Reform Act of 1995. Forward-looking statements involve a number of risks, uncertainties or other factors beyond the company’s control, which may cause material differences in actual results, performance or other expectations. These factors include, but are not limited to, general economic conditions, competition, new development, construction and ventures, substantial leverage and debt service, fluctuations in currency exchange rates and interest rates, government regulation, tax law changes and the impact of U.S. tax reform, legalization of gaming, natural or man-made disasters, terrorist acts or war, outbreaks of infectious diseases, insurance, gaming promoters, risks relating to our gaming licenses, certificate and subconcession, infrastructure in Macao, our subsidiaries’ ability to make distribution payments to us, and other factors detailed in the reports filed by Las Vegas Sands Corp. with the Securities and Exchange Commission. Readers are cautioned not to place undue reliance on these forward-looking statements, which speak only as of the date thereof. Las Vegas Sands Corp. assumes no obligation to update such information.
About The Company
Las Vegas Sands Corp. (NYSE: LVS) is the world’s pre-eminent developer and operator of world-class Integrated Resorts that feature luxury hotels; best-in-class gaming; retail; dining and entertainment; Meetings, Incentives, Convention and Exhibition (MICE) facilities; and many other leisure and business amenities. We pioneered the MICE-driven Integrated Resort model, a unique, industry-leading and extremely successful concept that serves both the leisure and business tourism markets.
Our properties include The Venetian and The Palazzo resorts and Sands Expo in Las Vegas, Sands Bethlehem in Eastern Pennsylvania, and the iconic Marina Bay Sands in Singapore. Through majority ownership in Sands China Ltd., LVS owns a portfolio of properties on the Cotai Strip in Macao, including The Venetian Macao, The Plaza and Four Seasons Hotel Macao, Sands Cotai Central and The Parisian Macao, as well as the Sands Macao on the Macao Peninsula.
LVS is dedicated to being a good corporate citizen, anchored by the core tenets of delivering a great working environment for 50,000 team members worldwide, driving impact through its Sands Cares corporate giving program and leading innovation with the company’s award-winning Sands ECO360 global sustainability program.
Contacts:
|
Investment |
Daniel Briggs |
(702) 414-1221 |
|
Media: |
Ron Reese |
(702) 414-3607 |
Las Vegas Sands Corp.
Third Quarter 2018 Results
Non-GAAP Measures
Within the company’s third quarter 2018 press release, the company makes reference to certain non-GAAP financial measures that supplement the company’s consolidated financial information prepared in accordance with accounting principles generally accepted in the United States of America (“GAAP”) including “adjusted net income,” “adjusted earnings per diluted share,” and “consolidated adjusted property EBITDA,” which have directly comparable GAAP financial measures along with “adjusted property EBITDA margin,” “hold-normalized adjusted property EBITDA,” “hold-normalized adjusted property EBITDA margin,” “hold-normalized adjusted net income,” and “hold-normalized adjusted earnings per diluted share.” The company believes these measures represent important internal measures of financial performance. Set forth in the financial schedules accompanying this release are reconciliations of the non-GAAP financial measures to the most directly comparable GAAP financial measures. The non-GAAP financial measure disclosure by the company has limitations and should not be considered a substitute for, or superior to, the financial measures prepared in accordance with GAAP. The definitions of our non-GAAP financial measures and the specific reasons why the company’s management believes the presentation of the non-GAAP financial measures provides useful information to investors regarding the company’s financial condition, results of operations and cash flows are presented below.
The following non-GAAP financial measures are used by management, as well as industry analysts, to evaluate the company’s operations and operating performance. These non-GAAP financial measures are presented so investors have the same financial data management uses in evaluating financial performance with the belief it will assist the investment community in properly assessing the underlying financial performance of the company on a year-over-year and a quarter sequential basis.
Adjusted net income, which is a non-GAAP financial measure, excludes certain non-recurring corporate expenses, pre-opening expense, development expense, gain or loss on disposal of assets, loss on modification or early retirement of debt and other income or expense, attributable to Las Vegas Sands, net of income tax and an adjustment for a nonrecurring non-cash benefit due to U.S. tax reform enacted in 2017. Adjusted net income and adjusted earnings per diluted share are presented as supplemental disclosures as management believes they are (1) each widely used measures of performance by industry analysts and investors and (2) a principal basis for valuation of Integrated Resort companies, as these non-GAAP measures are considered by many as alternative measures on which to base expectations for future results. These measures also form the basis of certain internal management performance expectations.
Consolidated adjusted property EBITDA, which is a non-GAAP financial measure, is net income before stock-based compensation expense, corporate expense, pre-opening expense, development expense, depreciation and amortization, amortization of leasehold interests in land, gain or loss on disposal of assets, interest, other income or expense, gain or loss on modification or early retirement of debt and income taxes. Management utilizes consolidated adjusted property EBITDA to compare the operating profitability of its operations with those of its competitors, as well as a basis for determining certain incentive compensation. Integrated Resort companies have historically reported adjusted property EBITDA as a supplemental performance measure to GAAP financial measures. In order to view the operations of their casinos on a more stand-alone basis, Integrated Resort companies, including Las Vegas Sands, have historically excluded certain expenses that do not relate to the management of specific properties, such as pre-opening expense, development expense and corporate expense, from their adjusted property EBITDA calculations. Consolidated adjusted property EBITDA should not be interpreted as an alternative to income from operations (as an indicator of operating performance) or to cash flows from operations (as a measure of liquidity), in each case, as determined in accordance with GAAP. The company has significant uses of cash flow, including capital expenditures, dividend payments, interest payments, debt principal payments and income tax payments, which are not reflected in consolidated adjusted property EBITDA. Not all companies calculate adjusted property EBITDA in the same manner. As a result, consolidated adjusted property EBITDA as presented by Las Vegas Sands may not be directly comparable to similarly titled measures presented by other companies.
Hold-normalized adjusted property EBITDA, a supplemental non-GAAP financial measure, that, in addition to the aforementioned reasons for the presentation of consolidated adjusted property EBITDA, is presented to adjust for the impact of certain variances in table games’ win percentages, which can vary from period to period. Hold-normalized adjusted property EBITDA is based on applying a Rolling Chip win percentage of 3.15% to the Rolling Chip volume for the quarter if the actual win percentage is outside the expected range of 3.0% to 3.3% for our Macao properties, applying a Rolling Chip win percentage of 2.85% to the Rolling Chip volume for the quarter if the actual win percentage is outside the expected range of 2.7% to 3.0% for our Singapore property, and applying a win percentage of 22.0% for Baccarat and 20.0% for non-Baccarat games to the respective table games drops for the quarter if the actual win percentages are outside the expected ranges of 18.0% to 26.0% for Baccarat and 16.0% to 24.0% for non-Baccarat at our Las Vegas properties. No hold adjustments are made for Sands Bethlehem. We do not present adjustments for Non-Rolling Chip drop for our table games play at our Macao and Singapore properties, nor for slots at any of our properties. Hold-normalized adjusted property EBITDA is also adjusted for the estimated gaming taxes, commissions paid to third parties on the incremental win, bad debt expense, discounts and other incentives that would have been incurred when applying the win percentages noted above to the respective gaming volumes. The hold-normalized adjusted property EBITDA measure presents a consistent measure for evaluating the operating performance of our properties from period to period.
Hold-normalized adjusted net income and hold-normalized adjusted earnings per diluted share are additional supplemental non-GAAP financial measures that, in addition to the aforementioned reasons for the presentation of adjusted net income and adjusted earnings per diluted share, are presented to adjust for the impact of certain variances in table games’ win percentages, which can vary from period to period.
The company may also present the above items on a constant currency basis. This information is a non-GAAP financial measure that is calculated by translating current quarter local currency amounts to U.S. dollars based on prior period exchange rates. These amounts are compared to the prior period to derive non-GAAP constant-currency growth/decline. Management considers non-GAAP constant-currency growth/decline to be a useful metric to investors and management as it allows a more direct comparison of current performance to historical performance.
The company also makes reference to adjusted property EBITDA margin and hold-normalized adjusted property EBITDA margin, which are calculated using the aforementioned non-GAAP financial measures.
|
Exhibit 1 |
||||||||||||||||
|
Las Vegas Sands Corp. and Subsidiaries |
||||||||||||||||
|
Condensed Consolidated Statements of Operations |
||||||||||||||||
|
(In millions, except per share data) |
||||||||||||||||
|
(Unaudited) |
||||||||||||||||
|
Three Months Ended |
Nine Months Ended |
|||||||||||||||
|
September 30, |
September 30, |
|||||||||||||||
|
2018 |
2017 |
2018 |
2017 |
|||||||||||||
|
Revenues: |
||||||||||||||||
|
Casino |
$ |
2,413 |
$ |
2,270 |
$ |
7,358 |
$ |
6,670 |
||||||||
|
Rooms |
435 |
405 |
1,298 |
1,170 |
||||||||||||
|
Food and beverage |
195 |
192 |
642 |
599 |
||||||||||||
|
Mall |
170 |
160 |
490 |
476 |
||||||||||||
|
Convention, retail and other |
159 |
134 |
466 |
422 |
||||||||||||
|
Net revenues |
3,372 |
3,161 |
10,254 |
9,337 |
||||||||||||
|
Operating expenses: |
||||||||||||||||
|
Resort operations |
2,093 |
1,956 |
6,257 |
5,783 |
||||||||||||
|
Corporate |
55 |
51 |
144 |
135 |
||||||||||||
|
Pre-opening |
2 |
1 |
5 |
7 |
||||||||||||
|
Development |
4 |
3 |
9 |
8 |
||||||||||||
|
Depreciation and amortization |
284 |
265 |
822 |
913 |
||||||||||||
|
Amortization of leasehold interests in land |
8 |
9 |
26 |
28 |
||||||||||||
|
Loss on disposal or impairment of assets |
4 |
21 |
114 |
27 |
||||||||||||
|
2,450 |
2,306 |
7,377 |
6,901 |
|||||||||||||
|
Operating income |
922 |
855 |
2,877 |
2,436 |
||||||||||||
|
Other income (expense): |
||||||||||||||||
|
Interest income |
22 |
4 |
36 |
11 |
||||||||||||
|
Interest expense, net of amounts capitalized |
(126) |
(83) |
(308) |
(240) |
||||||||||||
|
Other income (expense) |
16 |
(19) |
34 |
(80) |
||||||||||||
|
Loss on modification or early retirement of debt |
(52) |
— |
(55) |
(5) |
||||||||||||
|
Income before income taxes |
782 |
757 |
2,584 |
2,122 |
||||||||||||
|
Income tax (expense) benefit |
(83) |
(73) |
407 |
(220) |
||||||||||||
|
Net income |
699 |
684 |
2,991 |
1,902 |
||||||||||||
|
Net income attributable to noncontrolling interests |
(128) |
(115) |
(408) |
(306) |
||||||||||||
|
Net income attributable to Las Vegas Sands Corp. |
$ |
571 |
$ |
569 |
$ |
2,583 |
$ |
1,596 |
||||||||
|
Earnings per share: |
||||||||||||||||
|
Basic |
$ |
0.73 |
$ |
0.72 |
$ |
3.28 |
$ |
2.02 |
||||||||
|
Diluted |
$ |
0.73 |
$ |
0.72 |
$ |
3.27 |
$ |
2.01 |
||||||||
|
Weighted average shares outstanding: |
||||||||||||||||
|
Basic |
786 |
791 |
788 |
792 |
||||||||||||
|
Diluted |
787 |
792 |
789 |
793 |
||||||||||||
|
Dividends declared per common share |
$ |
0.75 |
$ |
0.73 |
$ |
2.25 |
$ |
2.19 |
||||||||
|
Note: |
The prior period presentation has been adjusted for the adoption of ASC 606, Revenue from Contracts with Customers, and conformed to the current period presentation. |
|
Exhibit 2 |
||||||||||||||||
|
Las Vegas Sands Corp. and Subsidiaries |
||||||||||||||||
|
Net Revenues and Adjusted Property EBITDA |
||||||||||||||||
|
(In millions) |
||||||||||||||||
|
(Unaudited) |
||||||||||||||||
|
Three Months Ended |
Nine Months Ended |
|||||||||||||||
|
September 30, |
September 30, |
|||||||||||||||
|
2018 |
2017 |
2018 |
2017 |
|||||||||||||
|
Net Revenues |
||||||||||||||||
|
The Venetian Macao |
$ |
857 |
$ |
702 |
$ |
2,555 |
$ |
2,102 |
||||||||
|
Sands Cotai Central |
537 |
467 |
1,595 |
1,365 |
||||||||||||
|
The Parisian Macao |
389 |
411 |
1,119 |
1,074 |
||||||||||||
|
The Plaza Macao and Four Seasons Hotel Macao |
167 |
140 |
544 |
413 |
||||||||||||
|
Sands Macao |
160 |
142 |
494 |
476 |
||||||||||||
|
Ferry Operations and Other |
42 |
40 |
123 |
119 |
||||||||||||
|
Macao Operations |
2,152 |
1,902 |
6,430 |
5,549 |
||||||||||||
|
Marina Bay Sands |
766 |
789 |
2,343 |
2,313 |
||||||||||||
|
Las Vegas Operating Properties |
379 |
387 |
1,258 |
1,224 |
||||||||||||
|
Sands Bethlehem |
138 |
144 |
408 |
426 |
||||||||||||
|
Intersegment Eliminations |
(63) |
(61) |
(185) |
(175) |
||||||||||||
|
$ |
3,372 |
$ |
3,161 |
$ |
10,254 |
$ |
9,337 |
|||||||||
|
Adjusted Property EBITDA |
||||||||||||||||
|
The Venetian Macao |
$ |
344 |
$ |
264 |
$ |
1,023 |
$ |
809 |
||||||||
|
Sands Cotai Central |
188 |
154 |
565 |
431 |
||||||||||||
|
The Parisian Macao |
122 |
136 |
352 |
324 |
||||||||||||
|
The Plaza Macao and Four Seasons Hotel Macao |
53 |
51 |
198 |
162 |
||||||||||||
|
Sands Macao |
41 |
41 |
140 |
134 |
||||||||||||
|
Ferry Operations and Other |
6 |
5 |
15 |
17 |
||||||||||||
|
Macao Operations |
754 |
651 |
2,293 |
1,877 |
||||||||||||
|
Marina Bay Sands |
419 |
442 |
1,328 |
1,298 |
||||||||||||
|
Las Vegas Operating Properties |
76 |
76 |
294 |
277 |
||||||||||||
|
Sands Bethlehem |
33 |
40 |
92 |
113 |
||||||||||||
|
$ |
1,282 |
$ |
1,209 |
$ |
4,007 |
$ |
3,565 |
|||||||||
|
Adjusted Property EBITDA as a Percentage of Net Revenues |
||||||||||||||||
|
The Venetian Macao |
40.1 |
% |
37.6 |
% |
40.0 |
% |
38.5 |
% |
||||||||
|
Sands Cotai Central |
35.0 |
% |
33.0 |
% |
35.4 |
% |
31.6 |
% |
||||||||
|
The Parisian Macao |
31.4 |
% |
33.1 |
% |
31.5 |
% |
30.2 |
% |
||||||||
|
The Plaza Macao and Four Seasons Hotel Macao |
31.7 |
% |
36.4 |
% |
36.4 |
% |
39.2 |
% |
||||||||
|
Sands Macao |
25.6 |
% |
28.9 |
% |
28.3 |
% |
28.2 |
% |
||||||||
|
Ferry Operations and Other |
14.3 |
% |
12.5 |
% |
12.2 |
% |
14.3 |
% |
||||||||
|
Macao Operations |
35.0 |
% |
34.2 |
% |
35.7 |
% |
33.8 |
% |
||||||||
|
Marina Bay Sands |
54.7 |
% |
56.0 |
% |
56.7 |
% |
56.1 |
% |
||||||||
|
Las Vegas Operating Properties |
20.1 |
% |
19.6 |
% |
23.4 |
% |
22.6 |
% |
||||||||
|
Sands Bethlehem |
23.9 |
% |
27.8 |
% |
22.5 |
% |
26.5 |
% |
||||||||
|
Total |
38.0 |
% |
38.2 |
% |
39.1 |
% |
38.2 |
% |
||||||||
|
Note: |
The prior period presentation has been adjusted for the adoption of ASC 606, Revenue from Contracts with Customers, and conformed to the current period presentation. |
|
Exhibit 3 |
||||||||||||||||
|
Las Vegas Sands Corp. and Subsidiaries |
||||||||||||||||
|
Non-GAAP Measure Reconciliation |
||||||||||||||||
|
(In millions) |
||||||||||||||||
|
(Unaudited) |
||||||||||||||||
|
The following is a reconciliation of Net Income to Consolidated Adjusted Property EBITDA and |
||||||||||||||||
|
Three Months Ended |
Nine Months Ended |
|||||||||||||||
|
September 30, |
September 30, |
|||||||||||||||
|
2018 |
2017 |
2018 |
2017 |
|||||||||||||
|
Net income |
$ |
699 |
$ |
684 |
$ |
2,991 |
$ |
1,902 |
||||||||
|
Add (deduct): |
||||||||||||||||
|
Income tax expense (benefit) |
83 |
73 |
(407) |
220 |
||||||||||||
|
Loss on modification or early retirement of debt |
52 |
— |
55 |
5 |
||||||||||||
|
Other (income) expense |
(16) |
19 |
(34) |
80 |
||||||||||||
|
Interest expense, net of amounts capitalized |
126 |
83 |
308 |
240 |
||||||||||||
|
Interest income |
(22) |
(4) |
(36) |
(11) |
||||||||||||
|
Loss on disposal or impairment of assets |
4 |
21 |
114 |
27 |
||||||||||||
|
Amortization of leasehold interests in land |
8 |
9 |
26 |
28 |
||||||||||||
|
Depreciation and amortization |
284 |
265 |
822 |
913 |
||||||||||||
|
Development expense |
4 |
3 |
9 |
8 |
||||||||||||
|
Pre-opening expense |
2 |
1 |
5 |
7 |
||||||||||||
|
Stock-based compensation (1) |
3 |
4 |
10 |
11 |
||||||||||||
|
Corporate expense |
55 |
51 |
144 |
135 |
||||||||||||
|
Consolidated Adjusted Property EBITDA |
$ |
1,282 |
$ |
1,209 |
$ |
4,007 |
$ |
3,565 |
||||||||
|
Hold-normalized casino revenue (2) |
(16) |
(13) |
||||||||||||||
|
Hold-normalized casino expense (2) |
4 |
(15) |
||||||||||||||
|
Consolidated Hold-Normalized Adjusted Property EBITDA |
$ |
1,270 |
$ |
1,181 |
||||||||||||
|
Note: |
The prior period presentation has been adjusted for the adoption of ASC 606, Revenue from Contracts with Customers, and conformed to the current period presentation. |
|
(1) |
During the three months ended September 30, 2018 and 2017, the company recorded stock-based compensation expense of $7 million and $8 million, respectively, of which $4 million in each period is included in corporate expense on the company’s condensed consolidated statements of operations. During the nine months ended September 30, 2018 and 2017, the company recorded stock-based compensation expense of $23 million and $26 million, respectively, of which $13 million and $15 million, respectively, is included in corporate expense on the company’s condensed consolidated statements of operations. |
|
(2) |
See Exhibit 4. |
|
Exhibit 4 |
||||||||||||||||
|
Las Vegas Sands Corp. and Subsidiaries |
||||||||||||||||
|
Non-GAAP Measure Reconciliation |
||||||||||||||||
|
(In millions) |
||||||||||||||||
|
(Unaudited) |
||||||||||||||||
|
The following are reconciliations of Adjusted Property EBITDA to Hold-Normalized Adjusted Property EBITDA: |
||||||||||||||||
|
Three Months Ended September 30, 2018 |
||||||||||||||||
|
Hold-Normalized |
||||||||||||||||
|
Adjusted |
Hold-Normalized |
Hold-Normalized |
Adjusted |
|||||||||||||
|
Property |
Casino |
Casino |
Property |
|||||||||||||
|
EBITDA |
Revenue (1) |
Expense (2) |
EBITDA |
|||||||||||||
|
Macao Operations |
$ |
754 |
$ |
— |
$ |
— |
$ |
754 |
||||||||
|
Marina Bay Sands |
419 |
(41) |
8 |
386 |
||||||||||||
|
United States: |
||||||||||||||||
|
Las Vegas Operating Properties |
76 |
25 |
(4) |
97 |
||||||||||||
|
Sands Bethlehem |
33 |
— |
— |
33 |
||||||||||||
|
$ |
1,282 |
$ |
(16) |
$ |
4 |
$ |
1,270 |
|||||||||
|
Three Months Ended September 30, 2017 |
||||||||||||||||
|
Hold-Normalized |
||||||||||||||||
|
Adjusted |
Hold-Normalized |
Hold-Normalized |
Adjusted |
|||||||||||||
|
Property |
Casino |
Casino |
Property |
|||||||||||||
|
EBITDA |
Revenue (1) |
Expense (2) |
EBITDA |
|||||||||||||
|
Macao Operations |
$ |
651 |
$ |
10 |
$ |
(20) |
$ |
641 |
||||||||
|
Marina Bay Sands |
442 |
(40) |
8 |
410 |
||||||||||||
|
United States: |
||||||||||||||||
|
Las Vegas Operating Properties |
76 |
17 |
(3) |
90 |
||||||||||||
|
Sands Bethlehem |
40 |
— |
— |
40 |
||||||||||||
|
$ |
1,209 |
$ |
(13) |
$ |
(15) |
$ |
1,181 |
|||||||||
|
Note: |
The prior period presentation has been adjusted for the adoption of ASC 606, Revenue from Contracts with Customers, and conformed to the current period presentation. |
|
(1) |
For Macao Operations and Marina Bay Sands, this represents the estimated incremental casino revenue related to Rolling Chip volume play that would have been earned or lost had the company’s current period win percentage equaled 3.15% for Macao Operations and 2.85% for Marina Bay Sands. This calculation will only be applied if the current period win percentage is outside the expected range of 3.0% to 3.3% for Macao Operations and 2.7% to 3.0% for Marina Bay Sands. |
|
For the Las Vegas Operating Properties, this represents the estimated incremental casino revenue related to all table games play that would have been earned or lost had the company’s current period win percentage equaled 22.0% for Baccarat and 20.0% for non-Baccarat. This calculation will only be applied if the current period win percentages for Baccarat and non-Baccarat are outside the expected ranges of 18.0% to 26.0% and 16.0% to 24.0%, respectively. |
|
|
For Sands Bethlehem, no adjustments have been made. |
|
|
These amounts have been offset by the estimated commissions paid and discounts and other incentives rebated directly or indirectly to customers. |
|
|
(2) |
Represents the estimated incremental expenses (gaming taxes and bad debt expense) that would have been incurred or avoided on the incremental casino revenue calculated in (1) above. |
|
Exhibit 5 |
||||||||||||||||
|
Las Vegas Sands Corp. and Subsidiaries |
||||||||||||||||
|
Non-GAAP Measure Reconciliation |
||||||||||||||||
|
(In millions, except per share data) |
||||||||||||||||
|
(Unaudited) |
||||||||||||||||
|
The following is a reconciliation of Net Income Attributable to LVS to Adjusted Net Income and Hold-Normalized Adjusted Net Income: |
||||||||||||||||
|
Three Months Ended |
Nine Months Ended |
|||||||||||||||
|
September 30, |
September 30, |
|||||||||||||||
|
2018 |
2017 |
2018 |
2017 |
|||||||||||||
|
Net income attributable to LVS |
$ |
571 |
$ |
569 |
$ |
2,583 |
$ |
1,596 |
||||||||
|
Pre-opening expense |
2 |
1 |
5 |
7 |
||||||||||||
|
Development expense |
4 |
3 |
9 |
8 |
||||||||||||
|
Loss on disposal or impairment of assets |
4 |
21 |
114 |
27 |
||||||||||||
|
Other (income) expense |
(16) |
19 |
(34) |
80 |
||||||||||||
|
Loss on modification or early retirement of debt |
52 |
— |
55 |
5 |
||||||||||||
|
Nonrecurring non-cash income tax benefit of U.S. tax reform (1) |
— |
— |
(670) |
— |
||||||||||||
|
Income tax impact on net income adjustments (2) |
(1) |
— |
(7) |
— |
||||||||||||
|
Noncontrolling interest impact on net income adjustments |
(12) |
(7) |
(42) |
(12) |
||||||||||||
|
Adjusted net income attributable to LVS |
$ |
604 |
$ |
606 |
$ |
2,013 |
$ |
1,711 |
||||||||
|
Hold-normalized casino revenue (3) |
(16) |
(13) |
||||||||||||||
|
Hold-normalized casino expense (3) |
4 |
(15) |
||||||||||||||
|
Income tax impact on hold adjustments (2) |
1 |
1 |
||||||||||||||
|
Noncontrolling interest impact on hold adjustments |
— |
3 |
||||||||||||||
|
Hold-normalized adjusted net income attributable to LVS |
$ |
593 |
$ |
582 |
||||||||||||
|
The following is a reconciliation of Diluted Earnings per Share to Adjusted Earnings per Diluted Share and |
||||||||||||||||
|
Three Months Ended |
Nine Months Ended |
|||||||||||||||
|
September 30, |
September 30, |
|||||||||||||||
|
2018 |
2017 |
2018 |
2017 |
|||||||||||||
|
Per diluted share of common stock: |
||||||||||||||||
|
Net income attributable to LVS |
$ |
0.73 |
$ |
0.72 |
$ |
3.27 |
$ |
2.01 |
||||||||
|
Pre-opening expense |
— |
— |
0.01 |
0.01 |
||||||||||||
|
Development expense |
0.01 |
0.01 |
0.01 |
0.01 |
||||||||||||
|
Loss on disposal or impairment of assets |
0.01 |
0.03 |
0.14 |
0.03 |
||||||||||||
|
Other (income) expense |
(0.02) |
0.02 |
(0.04) |
0.10 |
||||||||||||
|
Loss on modification or early retirement of debt |
0.06 |
— |
0.07 |
0.01 |
||||||||||||
|
Nonrecurring non-cash income tax benefit of U.S. tax reform |
— |
— |
(0.85) |
— |
||||||||||||
|
Income tax impact on net income adjustments |
— |
— |
(0.01) |
— |
||||||||||||
|
Noncontrolling interest impact on net income adjustments |
(0.02) |
(0.01) |
(0.05) |
(0.01) |
||||||||||||
|
Adjusted earnings per diluted share |
$ |
0.77 |
$ |
0.77 |
$ |
2.55 |
$ |
2.16 |
||||||||
|
Hold-normalized casino revenue |
(0.02) |
(0.02) |
||||||||||||||
|
Hold-normalized casino expense |
— |
(0.02) |
||||||||||||||
|
Income tax impact on hold adjustments |
— |
— |
||||||||||||||
|
Noncontrolling interest impact on hold adjustments |
— |
— |
||||||||||||||
|
Hold-normalized adjusted earnings per diluted share |
$ |
0.75 |
$ |
0.73 |
||||||||||||
|
Weighted average diluted shares outstanding |
787 |
792 |
789 |
793 |
||||||||||||
|
Note: |
The prior period presentation has been adjusted for the adoption of ASC 606, Revenue from Contracts with Customers, and conformed to the current period presentation. |
|
(1) |
Adjustment reflects the impact of the Tax Cuts and Jobs Act enacted in the U.S. in December 2017 (the “Act” or “tax reform”) on the valuation allowance related to certain of the company’s tax attributes. This adjustment includes estimates and assumptions based on the company’s initial analysis of the Act in applying it to the 2018 income tax provision and may be adjusted in future periods as required. The Act creates complexity and will require implementation guidance from the Internal Revenue Service and could impact the company’s tax return filing positions, which may impact the estimates and assumptions utilized in the initial analysis. |
|
(2) |
The income tax impact for each adjustment is derived by applying the effective tax rate, including current and deferred income tax expense, based upon the jurisdiction and the nature of the adjustment. |
|
(3) |
See Exhibit 4. |
|
Exhibit 6 |
||||||||||||||||
|
Las Vegas Sands Corp. and Subsidiaries |
||||||||||||||||
|
Supplemental Data |
||||||||||||||||
|
(Unaudited) |
||||||||||||||||
|
Three Months Ended |
Nine Months Ended |
|||||||||||||||
|
September 30, |
September 30, |
|||||||||||||||
|
2018 |
2017 |
2018 |
2017 |
|||||||||||||
|
Casino Statistics: |
||||||||||||||||
|
The Venetian Macao: |
||||||||||||||||
|
Table games win per unit per day (1) |
$ |
14,975 |
$ |
12,648 |
$ |
15,205 |
$ |
12,845 |
||||||||
|
Slot machine win per unit per day (2) |
$ |
200 |
$ |
239 |
$ |
233 |
$ |
243 |
||||||||
|
Average number of table games |
598 |
565 |
597 |
560 |
||||||||||||
|
Average number of slot machines |
1,634 |
1,675 |
1,729 |
1,623 |
||||||||||||
|
Sands Cotai Central: |
||||||||||||||||
|
Table games win per unit per day (1) |
$ |
12,077 |
$ |
10,264 |
$ |
11,990 |
$ |
10,286 |
||||||||
|
Slot machine win per unit per day (2) |
$ |
252 |
$ |
314 |
$ |
286 |
$ |
307 |
||||||||
|
Average number of table games |
410 |
392 |
410 |
398 |
||||||||||||
|
Average number of slot machines |
1,726 |
1,798 |
1,809 |
1,726 |
||||||||||||
|
The Parisian Macao: |
||||||||||||||||
|
Table games win per unit per day (1) |
$ |
12,634 |
$ |
12,258 |
$ |
11,785 |
$ |
10,055 |
||||||||
|
Slot machine win per unit per day (2) |
$ |
336 |
$ |
205 |
$ |
264 |
$ |
225 |
||||||||
|
Average number of table games |
332 |
377 |
345 |
381 |
||||||||||||
|
Average number of slot machines |
1,334 |
1,507 |
1,354 |
1,523 |
||||||||||||
|
The Plaza Macao and Four Seasons Hotel Macao: |
||||||||||||||||
|
Table games win per unit per day (1) |
$ |
16,933 |
$ |
14,627 |
$ |
17,856 |
$ |
14,066 |
||||||||
|
Slot machine win per unit per day (2) |
$ |
491 |
$ |
380 |
$ |
523 |
$ |
444 |
||||||||
|
Average number of table games |
115 |
103 |
115 |
101 |
||||||||||||
|
Average number of slot machines |
177 |
221 |
194 |
183 |
||||||||||||
|
Sands Macao: |
||||||||||||||||
|
Table games win per unit per day (1) |
$ |
8,521 |
$ |
6,853 |
$ |
8,820 |
$ |
8,206 |
||||||||
|
Slot machine win per unit per day (2) |
$ |
241 |
$ |
220 |
$ |
243 |
$ |
240 |
||||||||
|
Average number of table games |
207 |
192 |
204 |
200 |
||||||||||||
|
Average number of slot machines |
899 |
1,000 |
918 |
919 |
||||||||||||
|
Marina Bay Sands: |
||||||||||||||||
|
Table games win per unit per day (1) |
$ |
9,184 |
$ |
10,832 |
$ |
9,951 |
$ |
10,980 |
||||||||
|
Slot machine win per unit per day (2) |
$ |
802 |
$ |
666 |
$ |
800 |
$ |
658 |
||||||||
|
Average number of table games |
605 |
580 |
574 |
576 |
||||||||||||
|
Average number of slot machines |
2,171 |
2,499 |
2,281 |
2,493 |
||||||||||||
|
Las Vegas Operating Properties: |
||||||||||||||||
|
Table games win per unit per day (1) |
$ |
3,489 |
$ |
3,193 |
$ |
3,352 |
$ |
3,331 |
||||||||
|
Slot machine win per unit per day (2) |
$ |
351 |
$ |
324 |
$ |
351 |
$ |
299 |
||||||||
|
Average number of table games |
232 |
233 |
232 |
241 |
||||||||||||
|
Average number of slot machines |
1,833 |
1,892 |
1,753 |
1,945 |
||||||||||||
|
Sands Bethlehem: |
||||||||||||||||
|
Table games win per unit per day (1) |
$ |
3,066 |
$ |
3,651 |
$ |
3,138 |
$ |
3,539 |
||||||||
|
Slot machine win per unit per day (2) |
$ |
259 |
$ |
270 |
$ |
266 |
$ |
271 |
||||||||
|
Average number of table games |
189 |
175 |
182 |
176 |
||||||||||||
|
Average number of slot machines |
3,273 |
3,148 |
3,242 |
3,154 |
||||||||||||
|
(1) |
Table games win per unit per day is shown before discounts, commissions, deferring revenue associated with the company’s loyalty programs and allocating casino revenues related to goods and services provided to patrons on a complimentary basis. |
|
(2) |
Slot machine win per unit per day is shown before deferring revenue associated with the company’s loyalty programs and allocating casino revenues related to goods and services provided to patrons on a complimentary basis. |
|
Exhibit 7 |
||||||||||||||
|
Las Vegas Sands Corp. and Subsidiaries |
||||||||||||||
|
Supplemental Data |
||||||||||||||
|
(Unaudited) |
||||||||||||||
|
Three Months Ended |
||||||||||||||
|
The Venetian Macao |
September 30, |
|||||||||||||
|
(Dollars in millions) |
2018 |
2017 |
$ Change |
Change |
||||||||||
|
Revenues: |
||||||||||||||
|
Casino |
$ |
689 |
$ |
564 |
$ |
125 |
22.2 |
% |
||||||
|
Rooms |
58 |
44 |
14 |
31.8 |
% |
|||||||||
|
Food and Beverage |
21 |
19 |
2 |
10.5 |
% |
|||||||||
|
Mall |
60 |
55 |
5 |
9.1 |
% |
|||||||||
|
Convention, Retail and Other |
29 |
20 |
9 |
45.0 |
% |
|||||||||
|
Net Revenues |
$ |
857 |
$ |
702 |
$ |
155 |
22.1 |
% |
||||||
|
Adjusted Property EBITDA |
$ |
344 |
$ |
264 |
$ |
80 |
30.3 |
% |
||||||
|
EBITDA Margin % |
40.1 |
% |
37.6 |
% |
2.5 |
pts |
||||||||
|
Gaming Statistics |
||||||||||||||
|
(Dollars in millions) |
||||||||||||||
|
Rolling Chip Volume |
$ |
7,425 |
$ |
6,898 |
$ |
527 |
7.6 |
% |
||||||
|
Rolling Chip Win %(1) |
3.75 |
% |
3.28 |
% |
0.47 |
pts |
||||||||
|
Non-Rolling Chip Drop |
$ |
2,175 |
$ |
1,892 |
$ |
283 |
15.0 |
% |
||||||
|
Non-Rolling Chip Win % |
25.1 |
% |
22.8 |
% |
2.3 |
pts |
||||||||
|
Slot Handle |
$ |
807 |
$ |
718 |
$ |
89 |
12.4 |
% |
||||||
|
Slot Hold % |
3.7 |
% |
5.1 |
% |
(1.4) |
pts |
||||||||
|
Hotel Statistics |
||||||||||||||
|
Occupancy % |
95.7 |
% |
90.7 |
% |
5.0 |
pts |
||||||||
|
Average Daily Rate (ADR) |
$ |
229 |
$ |
218 |
$ |
11 |
5.0 |
% |
||||||
|
Revenue per Available Room (RevPAR) |
$ |
219 |
$ |
198 |
$ |
21 |
10.6 |
% |
||||||
|
Note: |
The prior period presentation has been adjusted for the adoption of ASC 606, Revenue from Contracts with Customers, and conformed to the current period presentation. |
|
(1) |
This compares to our expected Rolling Chip win percentage of 3.0% to 3.3% (calculated before discounts and commissions). |
|
Las Vegas Sands Corp. and Subsidiaries |
||||||||||||||
|
Supplemental Data |
||||||||||||||
|
(Unaudited) |
||||||||||||||
|
Three Months Ended |
||||||||||||||
|
Sands Cotai Central |
September 30, |
|||||||||||||
|
(Dollars in millions) |
2018 |
2017 |
$ Change |
Change |
||||||||||
|
Revenues: |
||||||||||||||
|
Casino |
$ |
400 |
$ |
341 |
$ |
59 |
17.3 |
% |
||||||
|
Rooms |
85 |
78 |
7 |
9.0 |
% |
|||||||||
|
Food and Beverage |
25 |
26 |
(1) |
(3.8) |
% |
|||||||||
|
Mall |
19 |
15 |
4 |
26.7 |
% |
|||||||||
|
Convention, Retail and Other |
8 |
7 |
1 |
14.3 |
% |
|||||||||
|
Net Revenues |
$ |
537 |
$ |
467 |
$ |
70 |
15.0 |
% |
||||||
|
Adjusted Property EBITDA |
$ |
188 |
$ |
154 |
$ |
34 |
22.1 |
% |
||||||
|
EBITDA Margin % |
35.0 |
% |
33.0 |
% |
2.0 |
pts |
||||||||
|
Gaming Statistics |
||||||||||||||
|
(Dollars in millions) |
||||||||||||||
|
Rolling Chip Volume |
$ |
2,564 |
$ |
2,846 |
$ |
(282) |
(9.9) |
% |
||||||
|
Rolling Chip Win %(1) |
3.95 |
% |
2.66 |
% |
1.29 |
pts |
||||||||
|
Non-Rolling Chip Drop |
$ |
1,650 |
$ |
1,442 |
$ |
208 |
14.4 |
% |
||||||
|
Non-Rolling Chip Win % |
21.5 |
% |
20.4 |
% |
1.1 |
pts |
||||||||
|
Slot Handle |
$ |
1,134 |
$ |
1,182 |
$ |
(48) |
(4.1) |
% |
||||||
|
Slot Hold % |
3.5 |
% |
4.4 |
% |
(0.9) |
pts |
||||||||
|
Hotel Statistics |
||||||||||||||
|
Occupancy % |
96.1 |
% |
93.0 |
% |
3.1 |
pts |
||||||||
|
Average Daily Rate (ADR) |
$ |
159 |
$ |
147 |
$ |
12 |
8.2 |
% |
||||||
|
Revenue per Available Room (RevPAR) |
$ |
153 |
$ |
137 |
$ |
16 |
11.7 |
% |
||||||
|
Note: |
The prior period presentation has been adjusted for the adoption of ASC 606, Revenue from Contracts with Customers, and conformed to the current period presentation. |
|
(1) |
This compares to our expected Rolling Chip win percentage of 3.0% to 3.3% (calculated before discounts and commissions). |
|
Las Vegas Sands Corp. and Subsidiaries |
||||||||||||||
|
Supplemental Data |
||||||||||||||
|
(Unaudited) |
||||||||||||||
|
Three Months Ended |
||||||||||||||
|
The Parisian Macao |
September 30, |
|||||||||||||
|
(Dollars in millions) |
2018 |
2017 |
$ Change |
Change |
||||||||||
|
Revenues: |
||||||||||||||
|
Casino |
$ |
321 |
$ |
341 |
$ |
(20) |
(5.9) |
% |
||||||
|
Rooms |
30 |
34 |
(4) |
(11.8) |
% |
|||||||||
|
Food and Beverage |
17 |
15 |
2 |
13.3 |
% |
|||||||||
|
Mall |
13 |
16 |
(3) |
(18.8) |
% |
|||||||||
|
Convention, Retail and Other |
8 |
5 |
3 |
60.0 |
% |
|||||||||
|
Net Revenues |
$ |
389 |
$ |
411 |
$ |
(22) |
(5.4) |
% |
||||||
|
Adjusted Property EBITDA |
$ |
122 |
$ |
136 |
$ |
(14) |
(10.3) |
% |
||||||
|
EBITDA Margin % |
31.4 |
% |
33.1 |
% |
(1.7) |
pts |
||||||||
|
Gaming Statistics |
||||||||||||||
|
(Dollars in millions) |
||||||||||||||
|
Rolling Chip Volume |
$ |
5,155 |
$ |
6,948 |
$ |
(1,793) |
(25.8) |
% |
||||||
|
Rolling Chip Win %(1) |
3.10 |
% |
3.11 |
% |
(0.01) |
pts |
||||||||
|
Non-Rolling Chip Drop |
$ |
1,046 |
$ |
1,001 |
$ |
45 |
4.5 |
% |
||||||
|
Non-Rolling Chip Win % |
21.6 |
% |
20.9 |
% |
0.7 |
pts |
||||||||
|
Slot Handle |
$ |
1,386 |
$ |
927 |
$ |
459 |
49.5 |
% |
||||||
|
Slot Hold % |
3.0 |
% |
3.1 |
% |
(0.1) |
pts |
||||||||
|
Hotel Statistics |
||||||||||||||
|
Occupancy % |
97.7 |
% |
94.1 |
% |
3.6 |
pts |
||||||||
|
Average Daily Rate (ADR) |
$ |
158 |
$ |
143 |
$ |
15 |
10.5 |
% |
||||||
|
Revenue per Available Room (RevPAR) |
$ |
154 |
$ |
134 |
$ |
20 |
14.9 |
% |
||||||
|
Note: |
The prior period presentation has been adjusted for the adoption of ASC 606, Revenue from Contracts with Customers, and conformed to the current period presentation. |
|
(1) |
This compares to our expected Rolling Chip win percentage of 3.0% to 3.3% (calculated before discounts and commissions). |
|
Las Vegas Sands Corp. and Subsidiaries |
||||||||||||||
|
Supplemental Data |
||||||||||||||
|
(Unaudited) |
||||||||||||||
|
Three Months Ended |
||||||||||||||
|
The Plaza Macao and Four Seasons Hotel Macao |
September 30, |
|||||||||||||
|
(Dollars in millions) |
2018 |
2017 |
$ Change |
Change |
||||||||||
|
Revenues: |
||||||||||||||
|
Casino |
$ |
116 |
$ |
93 |
$ |
23 |
24.7 |
% |
||||||
|
Rooms |
10 |
8 |
2 |
25.0 |
% |
|||||||||
|
Food and Beverage |
6 |
7 |
(1) |
(14.3) |
% |
|||||||||
|
Mall |
33 |
31 |
2 |
6.5 |
% |
|||||||||
|
Convention, Retail and Other |
2 |
1 |
1 |
100.0 |
% |
|||||||||
|
Net Revenues |
$ |
167 |
$ |
140 |
$ |
27 |
19.3 |
% |
||||||
|
Adjusted Property EBITDA |
$ |
53 |
$ |
51 |
$ |
2 |
3.9 |
% |
||||||
|
EBITDA Margin % |
31.7 |
% |
36.4 |
% |
(4.7) |
pts |
||||||||
|
Gaming Statistics |
||||||||||||||
|
(Dollars in millions) |
||||||||||||||
|
Rolling Chip Volume |
$ |
4,031 |
$ |
3,132 |
$ |
899 |
28.7 |
% |
||||||
|
Rolling Chip Win %(1) |
2.44 |
% |
2.23 |
% |
0.21 |
pts |
||||||||
|
Non-Rolling Chip Drop |
$ |
286 |
$ |
297 |
$ |
(11) |
(3.7) |
% |
||||||
|
Non-Rolling Chip Win % |
28.4 |
% |
23.1 |
% |
5.3 |
pts |
||||||||
|
Slot Handle |
$ |
141 |
$ |
117 |
$ |
24 |
20.5 |
% |
||||||
|
Slot Hold % |
5.7 |
% |
6.6 |
% |
(0.9) |
pts |
||||||||
|
Hotel Statistics |
||||||||||||||
|
Occupancy % |
89.0 |
% |
80.8 |
% |
8.2 |
pts |
||||||||
|
Average Daily Rate (ADR) |
$ |
315 |
$ |
333 |
$ |
(18) |
(5.4) |
% |
||||||
|
Revenue per Available Room (RevPAR) |
$ |
280 |
$ |
269 |
$ |
11 |
4.1 |
% |
||||||
|
Note: |
The prior period presentation has been adjusted for the adoption of ASC 606, Revenue from Contracts with Customers, and conformed to the current period presentation. |
|
(1) |
This compares to our expected Rolling Chip win percentage of 3.0% to 3.3% (calculated before discounts and commissions). |
|
Las Vegas Sands Corp. and Subsidiaries |
||||||||||||||
|
Supplemental Data |
||||||||||||||
|
(Unaudited) |
||||||||||||||
|
Three Months Ended |
||||||||||||||
|
Sands Macao |
September 30, |
|||||||||||||
|
(Dollars in millions) |
2018 |
2017 |
$ Change |
Change |
||||||||||
|
Revenues: |
||||||||||||||
|
Casino |
$ |
146 |
$ |
130 |
$ |
16 |
12.3 |
% |
||||||
|
Rooms |
4 |
5 |
(1) |
(20.0) |
% |
|||||||||
|
Food and Beverage |
6 |
6 |
— |
— |
% |
|||||||||
|
Mall |
1 |
— |
1 |
N.M. |
||||||||||
|
Convention, Retail and Other |
3 |
1 |
2 |
200.0 |
% |
|||||||||
|
Net Revenues |
$ |
160 |
$ |
142 |
$ |
18 |
12.7 |
% |
||||||
|
Adjusted Property EBITDA |
$ |
41 |
$ |
41 |
$ |
— |
— |
% |
||||||
|
EBITDA Margin % |
25.6 |
% |
28.9 |
% |
(3.3) |
pts |
||||||||
|
Gaming Statistics |
||||||||||||||
|
(Dollars in millions) |
||||||||||||||
|
Rolling Chip Volume |
$ |
1,799 |
$ |
680 |
$ |
1,119 |
164.6 |
% |
||||||
|
Rolling Chip Win %(1) |
2.72 |
% |
1.13 |
% |
1.59 |
pts |
||||||||
|
Non-Rolling Chip Drop |
$ |
619 |
$ |
603 |
$ |
16 |
2.7 |
% |
||||||
|
Non-Rolling Chip Win % |
18.3 |
% |
18.7 |
% |
(0.4) |
pts |
||||||||
|
Slot Handle |
$ |
646 |
$ |
602 |
$ |
44 |
7.3 |
% |
||||||
|
Slot Hold % |
3.1 |
% |
3.4 |
% |
(0.3) |
pts |
||||||||
|
Hotel Statistics |
||||||||||||||
|
Occupancy % |
97.5 |
% |
95.7 |
% |
1.8 |
pts |
||||||||
|
Average Daily Rate (ADR) |
$ |
155 |
$ |
191 |
$ |
(36) |
(18.8) |
% |
||||||
|
Revenue per Available Room (RevPAR) |
$ |
151 |
$ |
183 |
$ |
(32) |
(17.5) |
% |
||||||
|
N.M. |
Not Meaningful |
|
Note: |
The prior period presentation has been adjusted for the adoption of ASC 606, Revenue from Contracts with Customers, and conformed to the current period presentation. |
|
(1) |
This compares to our expected Rolling Chip win percentage of 3.0% to 3.3% (calculated before discounts and commissions). |
|
Las Vegas Sands Corp. and Subsidiaries |
||||||||||||||
|
Supplemental Data |
||||||||||||||
|
(Unaudited) |
||||||||||||||
|
Three Months Ended |
||||||||||||||
|
Marina Bay Sands |
September 30, |
|||||||||||||
|
(Dollars in millions) |
2018 |
2017 |
$ Change |
Change |
||||||||||
|
Revenues: |
||||||||||||||
|
Casino |
$ |
532 |
$ |
583 |
$ |
(51) |
(8.7) |
% |
||||||
|
Rooms |
106 |
94 |
12 |
12.8 |
% |
|||||||||
|
Food and Beverage |
53 |
46 |
7 |
15.2 |
% |
|||||||||
|
Mall |
44 |
42 |
2 |
4.8 |
% |
|||||||||
|
Convention, Retail and Other |
31 |
24 |
7 |
29.2 |
% |
|||||||||
|
Net Revenues |
$ |
766 |
$ |
789 |
$ |
(23) |
(2.9) |
% |
||||||
|
Adjusted Property EBITDA |
$ |
419 |
$ |
442 |
$ |
(23) |
(5.2) |
% |
||||||
|
EBITDA Margin % |
54.7 |
% |
56.0 |
% |
(1.3) |
pts |
||||||||
|
Gaming Statistics |
||||||||||||||
|
(Dollars in millions) |
||||||||||||||
|
Rolling Chip Volume |
$ |
7,093 |
$ |
9,443 |
$ |
(2,350) |
(24.9) |
% |
||||||
|
Rolling Chip Win %(1) |
3.43 |
% |
3.29 |
% |
0.14 |
pts |
||||||||
|
Non-Rolling Chip Drop(2) |
$ |
1,358 |
$ |
1,374 |
$ |
(16) |
(1.2) |
% |
||||||
|
Non-Rolling Chip Win %(2) |
19.7 |
% |
19.5 |
% |
0.2 |
pts |
||||||||
|
Slot Handle |
$ |
3,624 |
$ |
3,658 |
$ |
(34) |
(0.9) |
% |
||||||
|
Slot Hold % |
4.4 |
% |
4.2 |
% |
0.2 |
pts |
||||||||
|
Hotel Statistics |
||||||||||||||
|
Occupancy % |
97.5 |
% |
96.6 |
% |
0.9 |
pts |
||||||||
|
Average Daily Rate (ADR) |
$ |
466 |
$ |
447 |
$ |
19 |
4.3 |
% |
||||||
|
Revenue per Available Room (RevPAR) |
$ |
455 |
$ |
432 |
$ |
23 |
5.3 |
% |
||||||
|
Note: |
The prior period presentation has been adjusted for the adoption of ASC 606, Revenue from Contracts with Customers, and conformed to the current period presentation. |
|
(1) |
This compares to our expected Rolling Chip win percentage of 2.7% to 3.0% (calculated before discounts and commissions). |
|
(2) |
As of Q1 2018, Non-Rolling Chip drop at MBS includes chips purchased and exchanged at the cage. Prior period amounts have been updated to conform to the current period presentation. |
|
Las Vegas Sands Corp. and Subsidiaries |
||||||||||||||
|
Supplemental Data |
||||||||||||||
|
(Unaudited) |
||||||||||||||
|
Three Months Ended |
||||||||||||||
|
Las Vegas Operating Properties |
September 30, |
|||||||||||||
|
(Dollars in millions) |
2018 |
2017 |
$ Change |
Change |
||||||||||
|
Revenues: |
||||||||||||||
|
Casino |
$ |
88 |
$ |
92 |
$ |
(4) |
(4.3) |
% |
||||||
|
Rooms |
138 |
138 |
— |
— |
% |
|||||||||
|
Food and Beverage |
60 |
66 |
(6) |
(9.1) |
% |
|||||||||
|
Convention, Retail and Other |
93 |
91 |
2 |
2.2 |
% |
|||||||||
|
Net Revenues |
$ |
379 |
$ |
387 |
$ |
(8) |
(2.1) |
% |
||||||
|
Adjusted Property EBITDA |
$ |
76 |
$ |
76 |
$ |
— |
— |
% |
||||||
|
EBITDA Margin % |
20.1 |
% |
19.6 |
% |
0.5 |
pts |
||||||||
|
Gaming Statistics |
||||||||||||||
|
(Dollars in millions) |
||||||||||||||
|
Table Games Drop |
$ |
507 |
$ |
401 |
$ |
106 |
26.4 |
% |
||||||
|
Table Games Win %(1) |
14.7 |
% |
17.1 |
% |
(2.4) |
pts |
||||||||
|
Slot Handle |
$ |
692 |
$ |
658 |
$ |
34 |
5.2 |
% |
||||||
|
Slot Hold % |
8.6 |
% |
8.6 |
% |
— |
pts |
||||||||
|
Hotel Statistics |
||||||||||||||
|
Occupancy % |
94.4 |
% |
97.0 |
% |
(2.6) |
pts |
||||||||
|
Average Daily Rate (ADR) |
$ |
225 |
$ |
227 |
$ |
(2) |
(0.9) |
% |
||||||
|
Revenue per Available Room (RevPAR) |
$ |
213 |
$ |
220 |
$ |
(7) |
(3.2) |
% |
||||||
|
Note: |
The prior period presentation has been adjusted for the adoption of ASC 606, Revenue from Contracts with Customers, and conformed to the current period presentation. |
|
(1) |
This compares to our expected Baccarat win percentage of 18.0% to 26.0% and our expected non-Baccarat win percentage of 16.0% to 24.0% (calculated before discounts). |
|
Las Vegas Sands Corp. and Subsidiaries |
||||||||||||||
|
Supplemental Data |
||||||||||||||
|
(Unaudited) |
||||||||||||||
|
Three Months Ended |
||||||||||||||
|
Sands Bethlehem |
September 30, |
|||||||||||||
|
(Dollars in millions) |
2018 |
2017 |
$ Change |
Change |
||||||||||
|
Revenues: |
||||||||||||||
|
Casino |
$ |
121 |
$ |
126 |
$ |
(5) |
(4.0)% |
|||||||
|
Rooms |
4 |
4 |
— |
— |
% |
|||||||||
|
Food and Beverage |
7 |
7 |
— |
— |
% |
|||||||||
|
Mall |
1 |
1 |
— |
— |
% |
|||||||||
|
Convention, Retail and Other |
5 |
6 |
(1) |
(16.7) |
% |
|||||||||
|
Net Revenues |
$ |
138 |
$ |
144 |
$ |
(6) |
(4.2) |
% |
||||||
|
Adjusted Property EBITDA |
$ |
33 |
$ |
40 |
$ |
(7) |
(17.5) |
% |
||||||
|
EBITDA Margin % |
23.9 |
% |
27.8 |
% |
(3.9) |
pts |
||||||||
|
Gaming Statistics |
||||||||||||||
|
(Dollars in millions) |
||||||||||||||
|
Table Games Drop |
$ |
288 |
$ |
293 |
$ |
(5) |
(1.7) |
% |
||||||
|
Table Games Win % |
18.5 |
% |
20.1 |
% |
(1.6) |
pts |
||||||||
|
Slot Handle |
$ |
1,219 |
$ |
1,210 |
$ |
9 |
0.7 |
% |
||||||
|
Slot Hold % |
6.4 |
% |
6.5 |
% |
(0.1) |
pts |
||||||||
|
Hotel Statistics |
||||||||||||||
|
Occupancy % |
94.5 |
% |
96.1 |
% |
(1.6) |
pts |
||||||||
|
Average Daily Rate (ADR) |
$ |
165 |
$ |
164 |
$ |
1 |
0.6 |
% |
||||||
|
Revenue per Available Room (RevPAR) |
$ |
156 |
$ |
158 |
$ |
(2) |
(1.3) |
% |
||||||
|
Note: |
The prior period presentation has been adjusted for the adoption of ASC 606, Revenue from Contracts with Customers, and conformed to the current period presentation. |
|
Las Vegas Sands Corp. and Subsidiaries |
|||||||||||||||||||||
|
Supplemental Data – Asian Retail Mall Operations |
|||||||||||||||||||||
|
(Unaudited) |
|||||||||||||||||||||
|
For the Three Months Ended September 30, 2018 |
TTM September 30, |
||||||||||||||||||||
|
(Dollars in millions except per |
Gross |
Operating |
Operating |
Gross Leasable Area |
Occupancy % at End of Period |
Tenant Sales |
|||||||||||||||
|
Shoppes at Venetian |
$ |
59 |
$ |
53 |
89.8 |
% |
786,649 |
89.7 |
% |
$ |
1,733 |
||||||||||
|
Shoppes at Four Seasons |
|||||||||||||||||||||
|
Luxury Retail |
22 |
21 |
95.5 |
% |
142,562 |
100.0 |
% |
5,656 |
|||||||||||||
|
Other Stores |
11 |
10 |
90.9 |
% |
115,982 |
98.2 |
% |
1,918 |
|||||||||||||
|
Total |
33 |
31 |
93.9 |
% |
258,544 |
99.2 |
% |
4,260 |
|||||||||||||
|
Shoppes at Cotai Central(3) |
19 |
16 |
84.2 |
% |
509,929 |
92.3 |
% |
862 |
|||||||||||||
|
Shoppes at Parisian |
13 |
10 |
76.9 |
% |
295,896 |
90.7 |
% |
657 |
|||||||||||||
|
Total Cotai Strip in Macao |
124 |
110 |
88.7 |
% |
1,851,018 |
91.9 |
% |
1,718 |
|||||||||||||
|
The Shoppes at Marina Bay Sands |
44 |
38 |
86.4 |
% |
611,004 |
93.8 |
% |
1,840 |
|||||||||||||
|
Total |
$ |
168 |
$ |
148 |
88.1 |
% |
2,462,022 |
92.4 |
% |
$ |
1,748 |
||||||||||
|
Note: |
This table excludes the results of our mall operations at Sands Macao and Sands Bethlehem. |
|
(1) |
Gross revenue figures are net of intersegment revenue eliminations. |
|
(2) |
Tenant sales per square foot reflect sales from tenants only after the tenant has been open for a period of 12 months. |
|
(3) |
The Shoppes at Cotai Central will feature up to an estimated 600,000 square feet of gross leasable area at completion of all phases of Sands Cotai Central’s renovation, rebranding and expansion to The Londoner Macao. |
SOURCE Las Vegas Sands Corp.


Industry News
Europe Sports Betting Market Size, Share & Trends Analysis Report 2024-2030 Featuring Bet365, William Hill, Betfair, Paddy Power, 888sport, Bwin, Unibet, Ladbrokes, MGM, and Betsson
The “Europe Sports Betting Market Size, Share & Trends Analysis Report by Type, Platform, Sports Type (Football, Basketball, Baseball, Horse Racing, Cricket, Hockey, Others), Country, and Segment Forecasts, 2024-2030” report has been added to ResearchAndMarkets.com’s offering.
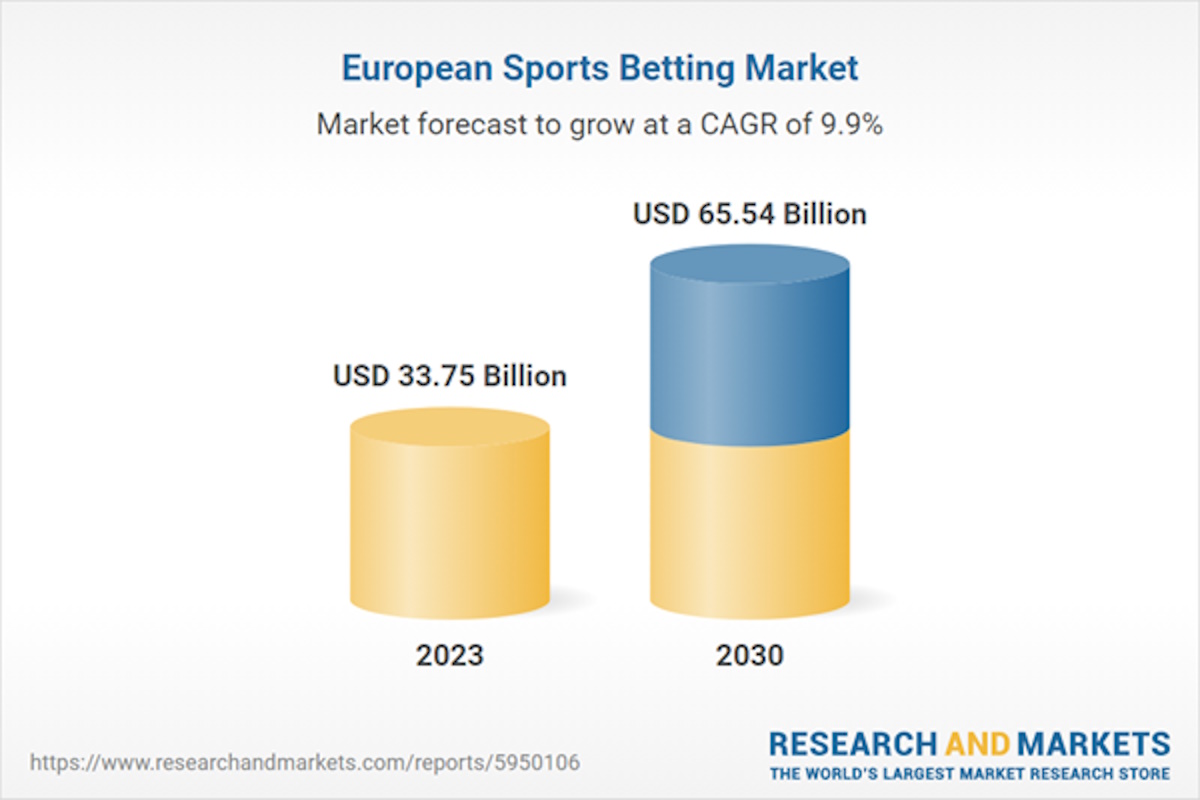
The Europe sports betting market size is anticipated to reach USD 65.54 billion by 2030 and is expected to expand at a CAGR of 9.9% from 2024 to 2030
The globalization of sports and the integration of international leagues and tournaments into European betting markets have fueled the growth of sports betting. Major sporting events such as the FIFA World Cup, UEFA European Championship, Wimbledon, and the Olympics attract widespread attention and betting interest from European consumers, driving significant betting volumes and revenues for sports betting operators, thus driving the growth of the sports betting market in Europe.
The COVID-19 pandemic had a negative impact on the European sports betting market. The cancellation or postponement of sports events during the pandemic restrained the market growth. With major tournaments, leagues, and competitions either suspended or canceled outright, the absence of live sports events severely diminished consumer betting opportunities. It led to a significant decline in betting volumes and revenues for sports betting operators.
The presence of favorable betting policies in the region is driving the growth of the sports betting market in the region. Many European countries, such as the UK, Ireland, Denmark, and France, have progressive policies promoting a competitive and well-regulated betting market. It facilitates the entry of new operators into the market and encourages competition, leading to innovation, improved services, and better value for consumers.
Moreover, established responsible gambling initiatives and regulatory bodies in Europe, such as the European Gaming & Betting Association, help build trust and confidence among consumers by promoting responsible gambling practices, ensuring fairness and transparency in betting operations, and providing avenues for dispute resolution, to protect consumers and maintain the integrity of the betting market, thus driving the growth of sports betting market in the region.
Europe Sports Betting Market Report Highlights
- Based on the type of betting, the fixed odd wagering segment accounted for the highest revenue share of 27.7% in 2023 due to the stability and predictability of the payouts
- Based on platform, the online segment dominated the market in 2023 and is expected to grow at a significant CAGR from 2024 to 2030. It can be attributed to the collaborations between sports teams, leagues, and betting companies, thus increasing the visibility of sports betting and attracting a larger customer base.
- In terms of sports type, the football segment accounted for the largest revenue share in 2023. It can be attributed to the popularity of football in Europe due to popular football clubs like Real Madrid, Liverpool FC, FC Barcelona, and Manchester United.
- The UK held a significant share of 34.6% in 2023 and is expected to grow at a significant CAGR during the forecast period. Favorable gambling policies in the country drive the market’s growth.
Company Profiles
- Bet365
- Ali William Hill
- Betfair
- Paddy Power
- 888sport
- Bwin
- Unibet
- Ladbrokes
- MGM Resorts International
- Betsson
Key Attributes:
| Report Attribute | Details |
| No. of Pages | 80 |
| Forecast Period | 2023 – 2030 |
| Estimated Market Value (USD) in 2023 | $33.75 Billion |
| Forecasted Market Value (USD) by 2030 | $65.54 Billion |
| Compound Annual Growth Rate | 9.9% |
| Regions Covered | Europe |
Key Topics Covered:
Chapter 1. Methodology and Scope
Chapter 2. Executive Summary
2.1. Market Outlook
2.2. Segment Outlook
2.3. Competitive Insights
Chapter 3. Europe Sports Betting Market Variables, Trends & Scope
3.1. Market Lineage Outlook
3.1.1. Parent market outlook
3.1.2. Related/ancillary market outlook
3.2. Market Dynamics
3.2.1. Market driver analysis
3.2.1.1. Increasing number of sport events
3.2.1.2. Growing number of sporting events and leagues in Europe
3.2.2. Market restraint analysis
3.2.2.1. Lack of unified regulations
3.2.3. Market opportunity analysis
3.2.3.1. Growth in E-sports audience
3.3. Europe Sports Betting Market Analysis Tools
3.3.1. Industry Analysis – Porter’s
3.3.2. PESTEL Analysis
Chapter 4. Europe Sports Betting Market: Platform Estimates & Trend Analysis
4.1. Platform Market Share, 2023 & 2030
4.2. Segment Dashboard
4.3. Europe Sports Betting Market by Platform Outlook
4.4. Market Size & Forecasts and Trend Analyses, 2018 to 2030
4.4.1. Offline
4.4.2. Online
Chapter 5. Europe Sports Betting Market: Type Estimates & Trend Analysis
5.1. Type Market Share, 2023 & 2030
5.2. Segment Dashboard
5.3. Europe Sports Betting Market by Type Outlook
5.4. Market Size & Forecasts and Trend Analyses, 2018 to 2030
5.4.1. Fixed odds wagering
5.4.2. Exchange Betting
5.4.3. Live/In Play Betting
5.4.4. eSports Betting
5.4.5. Others
Chapter 6. Europe Sports Betting Market: Sports Type Estimates & Trend Analysis
6.1. Sports Type Market Share, 2023 & 2030
6.2. Segment Dashboard
6.3. Europe Sports Betting Market by Sports Type Outlook
6.4. Market Size & Forecasts and Trend Analyses, 2018 to 2030
6.4.1. Football
6.4.2. Basketball
6.4.3. Baseball
6.4.4. Horse Racing
6.4.5. Cricket
6.4.6. Hockey
6.4.7. Others
Chapter 7. Europe Sports Betting Market: Regional Estimates & Trend Analysis
7.1. Regional Market Share Analysis, 2023 & 2030
7.2. Regional Market Dashboard
7.3. Regional Market Snapshot
7.4. Market Size, & Forecasts Trend Analysis, 2018 to 2030
7.4.1. UK
7.4.2. Germany
7.4.3. France
7.4.4. Italy
Chapter 8. Competitive Landscape
8.1. Recent Developments & Impact Analysis, By Key Market Participants
8.2. Company/Competition Categorization
8.3. Vendor Landscape
8.3.1. List of key distributors and channel partners
8.3.2. Key customers
8.4. Company Profiles
For more information about this report visit researchandmarkets.com
Industry News
Leading online slot developer announces launch of Snoop’s High Rollers which will go live exclusively with popular crypto sportsbook and casino

Gaming Corps, a publicly listed game development company based in Sweden, has signed a major deal that will see it launch an exclusive slot game in collaboration with rap legend, Snoop Dogg. The game will drop exclusively on Roobet, the online casino where Snoop Dogg is a brand ambassador.
Snoop Dogg needs no introduction. He made his music industry debut when he appeared on Dr Dre’s 1992 album, The Chronic, and has since sold more than 50 million albums worldwide. He’s also made several movie and TV show appearances, making him one of the most iconic artists of all time.
The game is “Snoop’s High Rollers” and allows players to experience what it’s like to live life as a music legend. The soundtrack is inspired by Snoop’s early and later works and the main man has also narrated parts of the game to really bring it to life.
Snoop has also played a part in creating the gameplay, hand-picking mechanics and bonus features to really put his stamp on the game. Roobet has also got in on the action, leading to a unique online slot that will soar to the top of the charts among its players.
Snoop’s High Rollers will make its debut exclusively on Roobet, the crypto casino and sportsbook that has taken the market by storm since its launch in 2019. The casino’s team has put a comprehensive marketing strategy behind the game with plans to use it to drive new customer acquisition at scale.
“It is with much pride that we at Gaming Corps have had the chance to develop a game in close collaboration with Snoop Dogg and Roobet, where we have combined our unique gaming perspective with Snoop Dogg’s unparalleled style and charisma,” Juha Kauppinen, Gaming Corps CEO, said:-
“Our vision is to offer players an experience where music, culture and gaming merge into something extraordinary. Our close collaboration with Roobet has enabled us to do the impossible, namely world-class marketing, game release is planned for 20 of April. We’re thrilled, and discussions are already underway about several game concepts!”
Anthony Brennan, Head of Partnerships at Roobet, added: “Roobet loves pushing the envelope and never flinches at an opportunity to bring iGaming and pop culture together. Snoop loves his game, we love the game, and we’ve been delighted at the experience of building something that feels fresh in an industry full of remixes.
“We can’t say enough nice things about the Gaming Corps team, and we’re excited to hear what the gaming community has to say!”

IDnow, a leading identity verification provider in Europe, has unveiled VideoIdent Flex, a new version of its expert-led video verification service that blends advanced AI technology with human interaction. The human-based video call solution, supported by AI, has been designed and built to boost customer conversion rates, reduce rising fraud attempts, increase inclusivity, and tackle an array of complex online verification scenarios, while offering a high-end service experience to end customers.
The company’s original expert-led product, VideoIdent, has been a cornerstone in identity verification for over a decade, serving the strictest requirements in highly regulated industries across Europe. VideoIdent Flex, re-engineered specifically for the UK market, represents a significant evolution, addressing the growing challenges of identity fraud, compliance related to Know-Your-Customer (KYC) and Anti-Money Laundering (AML) processes and ensuring fair access and inclusivity in today’s digital world outside of fully automated processes.
As remote identity verification becomes more crucial yet more challenging, VideoIdent Flex combines high-quality live video identity verification with hundreds of trained verification experts, thus ensuring that genuine customers gain equal access to digital services while effectively deterring fraudsters and money mules. Unlike fully automated solutions based on document liveness and biometric liveness features, this human-machine collaboration not only boosts onboarding rates and prevents fraud but also strengthens trust and confidence in both end users and organisations. VideoIdent Flex can also serve as a fallback service in case a fully automated solution fails.
Bertrand Bouteloup, Chief Commercial Officer at IDnow, said: “VideoIdent Flex marks a groundbreaking advancement in identity verification, merging AI-based technology with human intuition. In a landscape of evolving fraud tactics and steady UK bank branch closures, our solution draws on our decade’s worth of video verification experience and fraud insights, empowering UK businesses to maintain a competitive edge by offering a white glove service for VIP onboarding. With its unique combination of KYC-compliant identity verification, real-time fraud prevention solutions, and expert support, VideoIdent Flex is a powerful tool for the UK market.”
Whereas previously firms may have found video identification solutions to be excessive for their compliance requirement or out of reach due to costs, VideoIdent Flex opens up this option by customising checks as required by the respective regulatory bodies in financial services, mobility, telecommunications or gaming, to offer a streamlined solution fit for every industry and geography.
Bouteloup added: “Identity verification is incredibly nuanced; it’s as intricate as we are as human beings. This really compounds the importance of adopting a hybrid approach to identity – capitalising on the dual benefits of advanced technology when combined with human knowledge and awareness of social cues. With bank branches in the UK closing down, especially in the countryside, and interactions becoming more and more digital, our solution offers a means to maintain a human relationship between businesses and their end customers, no matter their age, disability or neurodiversity.
“VideoIdent Flex is designed from the ground up for organisations that cannot depend on a one-size-fits-all approach to ensuring their customers are who they say they are. In a world where fraud is consistently increasing, our video capability paired with our experts adds a powerful layer of security, especially for those businesses and customers that require a face-to-face interaction.”


Spinomenal debuts Queen of the Amazon slot

Playson grants clown unlimited powers in Energy Joker: Hold and Win

Altenar releases trio of betting widgets to enhance customer engagement

Luxury and grandeur await in latest Blueprint Gaming title Midas King of Gold

BGC Grand National Charity Bet Campaign Raises Thousands for Good Causes Across the Country

New Survey Reveals 80% of Lithuanians Would Welcome a Ban on Gambling Ads

SkyCity Appoints Jason Walbridge as Chief Executive Officer

NetBet Casino Joins Forces with Play’n Go

1Stop Translations Partners with Suss Ads

Sponsors Spotlight: iGaming Mastery Insights by Atlas-IAC and its CMO, Bogdana Yavorskaya

GiG bags a brace of deals for Spain and Argentina, with two new partners for its iGaming platform CoreX and Sportsbook, SportX

2024 Gaming in Spain Conference

HIPTHER’s Prague Gaming & TECH Summit 2024 reaches new milestones with record registrations and prominent sponsors

IGT Announces Executive and Board Leadership Changes

HIPTHER’s Prague Gaming & TECH Summit 2024 Boasts All-star Sponsors and Record Registrations

Meet GR8 Tech at the Prague Gaming & TECH Summit on March 26-27
-

 Conferences in Europe6 days ago
Spanish Advertising Restrictions Struck Down: Learn More at the 2024 Gaming in Spain Conference
-
Asia7 days ago
Asia-Pacific Sports Betting Market Report 2024-2030, Featuring Dafabet, SBOBET, 1xBet, TAB, CrownBet, UBET, Sports Toto Malaysia, Mansion88, 12BET and W88
-
Asia7 days ago
Profiles of Animesh Agarwal, Naman Mathur, Payal Dhare and Tirth Mehta
-
Latest News7 days ago
SOFTSWISS & BitStarz Celebrate Ten Years of Partnership
-
eSports6 days ago
Copenhagen Major 2024 – Betting Overview
-
Compliance Updates6 days ago
IOC and UEFA host joint betting integrity workshop
-
Balkans6 days ago
Making a Bang in Bulgaria! Hacksaw Gaming goes live with Alphawin
-
Latest News6 days ago
Inspired steps into Spring with its latest line up of slots: Space Invaders Win And Spin, Big Big Fishing Fortune and Piggy Bandits


