Latest News
Everi Reports 2019 Third Quarter Results

- Revenues increased 12% to a quarterly record $134.6 million, reflecting growth in both Games and FinTech revenues
- Net income improved 350% to $9.3 million from $2.1 million; diluted earnings per share more than tripled to $0.12 from $0.03 a year ago
- Adjusted EBITDA increased 11% to a quarterly record $64.7 million
- Reiterates full-year revenues and Adjusted EBITDA guidance
Everi Holdings Inc. (NYSE: EVRI) (“Everi” or the “Company”), the gaming industry’s premier single-source provider of gaming products, financial technology and loyalty solutions, today reported record financial results for the third quarter ended September 30, 2019 and reiterated its financial targets for the full year.
“Our record quarterly financial results can be directly attributed to the value of our product development initiatives and the operating strategies we adopted. Together, these are driving ongoing growth across our business,” said Michael Rumbolz, President and CEO. “This was our 13th consecutive quarter of year-over-year growth in revenue and Adjusted EBITDA. Our revenue rose 12% to $134.6 million. Third quarter 2019 net income was $9.3 million and diluted earnings per share more than tripled to $0.12. Adjusted EBITDA improved 11% to $64.7 million. We generated Free Cash Flow of $11.0 million in the quarter and $39.3 million year-to-date. This continuing positive progress in our financial results, includes another quarter of strong performance in both our Games and our FinTech businesses. These achievements are due to the passion and dedication of all our team members who help our customers grow their businesses by providing them with innovative solutions and world-class customer service. Given the ongoing strength of our business and growth opportunities, we remain on track to generate full-year results in line with our financial targets.”
Randy Taylor, Executive Vice President and Chief Financial Officer, said, “Our Free Cash Flow continues to accelerate and, with our continued focus on reducing leverage, we paid down $8.0 million on our term loan during the third quarter, bringing our year-to-date total debt repayment to $25.7 million. As a result, our total Net Debt Leverage Ratio improved to 4.5 times at September 30, 2019. With our enhanced performance and the ongoing benefits from the prudent capital investments we are making in both our Games and FinTech operations, we are well positioned to maintain our growth profile in the 2019 fourth quarter and into 2020, which we expect will drive further improvements in our capital structure and lower our cost of capital.”
Consolidated Full Quarter Comparative Results (unaudited)
| Three Months Ended September 30, | |||||
| 2019 | 2018 | ||||
| (in millions, except per share amounts) | |||||
| Revenues | $ | 134.6 | $ | 120.3 | |
| Operating income | $ | 27.3 | $ | 21.5 | |
| Net income | $ | 9.3 | $ | 2.1 | |
| Net earnings per diluted share | $ | 0.12 | $ | 0.03 | |
| Diluted shares outstanding | 79.1 | 74.6 | |||
| Adjusted EBITDA (1) (2) | $ | 64.7 | $ | 58.3 | |
(1) Adjusted EBITDA for the three months ended September 30, 2018 excludes the benefit of approximately $0.6 million related to an adjustment to certain purchase accounting liabilities related to the Company’s acquisition of certain compliance assets in 2015.
(2) For a reconciliation of net income to Adjusted EBITDA, see the Unaudited Reconciliation of Net Income to EBITDA and Adjusted EBITDA and to Free Cash Flow provided at the end of this release.
Mr. Rumbolz added, “Especially noteworthy for our third quarter Games’ segment performance was the combination of the significant quarterly sequential growth in our installed base, which rose 578 units primarily in our Premium units, and the year-over-year increase in daily win per unit (“DWPU”) for the quarter, which improved more than 15% to an all-time high of $33.95. These gains are a direct result of the improved performance of the products we introduced during the last several years and the expanded categories of game types we now address on the slot floor. The same innovation demonstrated in our newest premium units is also being applied to the development of our standard games, as we focus on building a deeper library of games to support our growing portfolio of cabinets. We believe this focus will enable Everi to deliver full-year unit sales growth and expand our ship share.
“Growth in our FinTech segment is attributable to our unique ability to offer a comprehensive portfolio of integrated solutions that allow customers to operate more efficiently and productively. At the same time, we also maximize funds delivered to our customers’ casino floors. We continue to generate steady organic growth, while also benefitting from the acquisition earlier this year of player loyalty and marketing products. As a complementary addition to our FinTech portfolio, this business is proving to be both strategic and highly accretive. Also driving growth is the replacement of older kiosks and other equipment, as our customers look to further improve their efficiencies with the newest enhancements and latest innovations embedded in all our products.”
Mr. Rumbolz further commented, “The favorable customer reaction to our newest Games and FinTech solutions at the recent G2E® show bolsters our confidence in our near- and long-term outlook that we can generate consistent profitable revenue growth and Free Cash Flow generation. For our Games segment, our broad offering of new products across the spectrum of premium mechanical, premium video, standard mechanical, standard video and wide-area progressive (“WAP”) games, including the extensive depth of new game content, were very favorably received by customers. New games, such as The Vault™, an innovative premium game that is a follow-on theme to our very successful Discovery Channel’s Shark Week® game, our Cash Machine™ high-denomination mechanical reel and the new Empire Flex™ for-sale video cabinet with a library of unique new titles were among the highlights for our customers at G2E.
“Our visionary CashClub® Wallet, with its compelling customer and player dynamics that link our ‘Digital Neighborhood’ of products, garnered especially favorable responses from customers at G2E. Our FinTech product portfolio has never been stronger. Our new loyalty and marketing kiosks and programs, the integrated nature of our comprehensive offering, and the growing number of solutions we offer customers are all designed to retain players with a seamless and convenient experience at our customers’ properties. All of this further strengthens our ability to deliver consistent future growth across our Games and FinTech businesses, including opportunities to continue to gain market share.”
Third Quarter 2019 Results Overview
Revenues for the third quarter of 2019 increased 12% to a record $134.6 million, from $120.3 million in the third quarter of 2018. Games and FinTech segment revenues increased 5% to $69.3 million and 20% to $65.3 million, respectively, for the third quarter of 2019.
Operating income increased 27% to $27.3 million for the third quarter of 2019 compared to $21.5 million in the third quarter of 2018, reflecting an approximately 200 basis point improvement in operating margin to 20% from 18%. Net income increased 350% to $9.3 million and diluted earnings per share more than tripled to $0.12, compared with net income of $2.1 million and $0.03 per diluted share, in the prior-year period.
Adjusted EBITDA for the third quarter of 2019 increased 11% to a record $64.7 million from $58.3 million in the third quarter of 2018. Games and FinTech segment Adjusted EBITDA increased to $34.6 million and $30.1 million, respectively, for the three months ended September 30, 2019, compared with Games and FinTech Adjusted EBITDA for the third quarter 2018 of $31.8 million and $26.5 million, respectively.
Games Segment Full Quarter Comparative Results (unaudited)
| Three Months Ended September 30, | ||||||
| 2019 | 2018 | |||||
| (in millions, except unit amounts and prices) | ||||||
| Revenues | $ | 69.3 | $ | 65.8 | ||
| Operating income (loss) | $ | 3.1 | $ | (0.7 | ) | |
| Adjusted EBITDA (1) | $ | 34.6 | $ | 31.8 | ||
| Unit sales: | ||||||
| Units sold | 1,040 | 1,165 | ||||
| Average sales price (“ASP”) | $ | 17,983 | $ | 17,005 | ||
| Gaming operations installed base: | ||||||
| Average units installed during period: | ||||||
| Average units installed | 13,979 | 14,233 | ||||
| Approximate daily win per unit (2) | $ | 33.95 | $ | 29.45 | ||
| Units installed at end of period: | ||||||
| Class II | 9,188 | 9,478 | ||||
| Class III | 5,084 | 4,638 | ||||
| Total installed base | 14,272 | 14,116 | ||||
| Installed base – Oklahoma | 6,351 | 6,598 | ||||
| Installed base – non-Oklahoma | 7,921 | 7,518 | ||||
| Total installed base | 14,272 | 14,116 | ||||
| Premium units | 4,395 | 2,840 | ||||
(1) For a reconciliation of net income to Adjusted EBITDA, see the Unaudited Reconciliation of Net Income to EBITDA and Adjusted EBITDA and to Free Cash Flow provided at the end of this release.
(2) Approximate daily win per unit excludes the impact of the direct costs associated with the Company’s wide-area progressive jackpot expense.
2019 Third Quarter Games Segment Highlights
Games segment revenues increased 5% to $69.3 million in the third quarter of 2019 compared to $65.8 million in the third quarter of 2018.
- Revenues from gaming operations increased $5.0 million, or 11%, to a record $48.5 million in the third quarter of 2019, compared to $43.5 million in the prior-year period. The year-over-year improvement primarily reflects a 15% increase in estimated DWPU.
° DWPU increased 15%, or $4.50, to a record $33.95 in the third quarter of 2019, compared to $29.45 in the prior-year period. The increase reflects, in part, improvements in overall unit performance following the Company’s investments in design and development of new games and cabinets, capital investments to refresh and upgrade a significant portion of the installed base over the last several years and the growth in premium unit placements, including WAP games. This was the eighth consecutive quarter of year-over-year growth in DWPU.
° The installed base at September 30, 2019 increased by 156 units year over year to a record quarter-ending level of 14,272 units and grew by 578 units on a quarterly sequential basis, primarily reflecting the continued expansion of premium units within the installed base. With more than 30% of the installed units now being premium games and the steady demand for its newest products, the Company is favorably positioned for further gaming operations revenue growth in the fourth quarter.
° The premium portion of the installed base increased 55% year over year, or by 1,555 units, to 4,395 units, which was 982 units higher on a quarterly sequential basis. WAP units, a subcomponent of premium units, grew by 331 units year over year and by 66 units on a quarterly sequential basis to 866 units at September 30, 2019.
° Interactive revenue more than doubled to $1.2 million in the third quarter of 2019 compared to $0.5 million in the prior-year period.
° Revenues from the New York Lottery business were $4.8 million in the third quarter of 2019 compared to $4.7 million in the prior-year period. - Revenues generated from the sale of gaming units and other related parts and equipment totaled $19.6 million in the third quarter of 2019 compared to revenues of $21.1 million in the prior-year period. Unit sales decreased by 125 units to 1,040 units in the third quarter of 2019 compared to 1,165 units in the prior-year period, primarily reflecting a 60-unit decrease in sales to international customers and a 120-unit conversion from lease to sale at one customer location in the prior year. The ASP increased to $17,983 compared with $17,005 in the prior-year period. The ASP for the third quarter 2018 reflects the lower-priced international unit sales.
- Other gaming revenues, which primarily includes revenues from TournEvent of Champions® qualifying events at participating casinos, was $1.1 million for the third quarter of 2019 compared with $1.2 million in the prior-year period.
Financial Technology Solutions Segment Full Quarter Comparative Results (unaudited)
| Three Months Ended September 30, | |||||
| 2019 | 2018 | ||||
| (in millions, unless otherwise noted) | |||||
| Revenues | $ | 65.3 | $ | 54.5 | |
| Operating income | $ | 24.2 | $ | 22.2 | |
| Adjusted EBITDA (1) (2) | $ | 30.1 | $ | 26.5 | |
| Aggregate dollar amount processed (in billions): | |||||
| Cash advance | $ | 1.9 | $ | 1.8 | |
| ATM | $ | 5.4 | $ | 4.9 | |
| Check warranty | $ | 0.4 | $ | 0.3 | |
| Number of transactions completed (in millions): | |||||
| Cash advance | 3.0 | 2.8 | |||
| ATM | 25.0 | 23.4 | |||
| Check warranty | 0.9 | 0.9 | |||
(1) Adjusted EBITDA for the three months ended September 30, 2018 excludes the benefit of approximately $0.6 million related to an adjustment to certain purchase accounting liabilities related to the Company’s acquisition of certain compliance assets in 2015.
(2) For a reconciliation of net income to Adjusted EBITDA, see the Unaudited Reconciliation of Net Income to EBITDA and Adjusted EBITDA and to Free Cash Flow at the end of this release.
2019 Third Quarter Financial Technology Solutions Segment Highlights
FinTech revenues increased $10.8 million, or 20%, to $65.3 million in the third quarter of 2019 compared to $54.5 million in the prior-year period, reflecting 11% organic growth and $4.6 million in revenues from the player loyalty and marketing business acquired in March 2019.
- Revenues from cash access services, which include ATM, cash advance and check services, increased 10% to $43.2 million in the third quarter of 2019 compared to $39.4 million in the third quarter of 2018. Third quarter 2019 cash access services revenues reflect the benefit from increased transactions and dollars processed, as well as the benefits from new customer wins from competitive bid processes and new casino openings and expansions. This was the 20th consecutive quarter of growth in both the number of transactions and total dollars processed on a same-store basis.
- Equipment sales revenues rose $3.0 million, or 42%, to $10.2 million in the third quarter of 2019 compared to $7.2 million in the third quarter of 2018. This increase is primarily due to a 25% increase in year-over-year sales of fully integrated kiosks and other value-add products that improve operator efficiencies and productivity, along with $1.2 million of player loyalty and marketing kiosk sales.
- Revenues from information services and other, which includes kiosk maintenance, compliance products, Central Credit, player loyalty and other revenue, increased $4.1 million, or 52%, to $12.0 million, in the third quarter of 2019 compared to $7.9 million in the third quarter of 2018. The increase is primarily due to $3.4 million of revenues related to recurring software license support for the player loyalty and marketing business together with an 8% increase in organic revenue.
2019 Outlook
Everi today reiterated its 2019 expectation of generating annual growth in revenue, Adjusted EBITDA and Free Cash Flow. The target for Adjusted EBITDA is reaffirmed as a range of $252 million to $255 million, reflecting the continued broad-based growth across the Company’s operating segments.
Given the significant success being achieved in the Company’s gaming operations business, evidenced by its higher DWPU and the continued strong demand for its premium gaming machines, Everi expects to further grow its installed base in the 2019 fourth quarter. The Company believes its ending installed base at December 31, 2019 will be in the range of 14,500 to 14,700 units. The Company now expects its capital expenditures and placement fees, including the capital expenditures related to the player loyalty acquisition, for 2019 to be approximately $130 million to $133 million, exceeding the Company’s previous range of $122 million to $125 million. As a result of this increased investment in the second half of 2019 to support momentum in its high-margin gaming operations’ unit placements, which are expected to help drive growth in 2020, the Company expects 2019 Free Cash Flow will be within a range of $42 million to $45 million.
For a reconciliation of projected net income to projected Adjusted EBITDA, see the Reconciliation of Projected Net Income to Projected EBITDA, Projected Adjusted EBITDA and Free Cash Flow provided at the end of this release.
Investor Conference Call and Webcast
The Company will host an investor conference call to discuss its 2019 third quarter results at 5:00 p.m. ET today. The conference call may be accessed live by phone by dialing +1 (323) 794-2551. A replay of the call will be available beginning at 8:00 p.m. ET today and may be accessed by dialing +1 (412) 317-6671; the PIN number is 7029323. A replay will be available until November 12, 2019. The call will also be webcast live and archived on the Company’s website at www.everi.com (select “Investors” followed by “Events & Presentations”).
Non-GAAP Financial Information
In order to enhance investor understanding of the underlying trends in our business, our cash balance and cash available for our operating needs, and to provide for better comparability between periods in different years, we are providing in this press release Adjusted EBITDA, Free Cash Flow, Net Cash Position and Net Cash Available, and Total Net Debt and Total Net Debt Leverage Ratio, which are not measures of our financial performance or position under United States Generally Accepted Accounting Principles (“GAAP”). Accordingly, Adjusted EBITDA, and Free Cash Flow should not be considered in isolation or as a substitute for measures prepared in accordance with GAAP. These measures should be read in conjunction with our net earnings, operating income, basic and diluted earnings per share, and cash flow data prepared in accordance with GAAP. With respect to Net Cash Position and Net Cash Available, these measures should be read in conjunction with cash and cash equivalents prepared in accordance with GAAP. Total Net Debt and Total Net Debt Leverage Ratio should be read in conjunction with principal face value of debt outstanding and cash and cash equivalents.
We define Adjusted EBITDA as earnings before interest, loss on extinguishment of debt, taxes, depreciation and amortization, non-cash stock compensation expense, accretion of contract rights, the write-off of inventory and fixed assets, certain purchase accounting adjustments and asset acquisition expense and other non-recurring professional service fees. We present Adjusted EBITDA as we use this measure to manage our business and consider this measure to be supplemental to our operating performance. We also make certain compensation decisions based, in part, on our operating performance, as measured by Adjusted EBITDA; and our current credit facility and existing senior unsecured notes require us to comply with a consolidated secured leverage ratio that includes performance metrics substantially similar to Adjusted EBITDA.
We define Free Cash Flow as Adjusted EBITDA less cash paid for interest, cash paid for capital expenditures, cash paid for placement fees, and cash paid for taxes net of refunds. We present Free Cash Flow as a measure of performance and believe it provides investors with another indicator of our operating performance. It should not be inferred that the entire Free Cash Flow amount is available for discretionary expenditures.
A reconciliation of the Company’s net income per GAAP to Adjusted EBITDA and Free Cash Flow is included in the Unaudited Reconciliation of Net Income to EBITDA and Adjusted EBITDA and to Free Cash Flow provided at the end of this release. Additionally, a reconciliation of each segment’s operating income to EBITDA and Adjusted EBITDA is also included. On a segment level, operating income per GAAP, rather than net earnings per GAAP, is reconciled to EBITDA and Adjusted EBITDA as the Company does not report net earnings by segment. Management believes that this presentation is meaningful to investors in evaluating the performance of the Company’s segments.
We define (i) Net Cash Position as cash and cash equivalents plus settlement receivables less settlement liabilities and (ii) Net Cash Available as Net Cash Position plus undrawn amounts available under our revolving credit facility. We present Net Cash Position because our cash position, as measured by cash and cash equivalents, depends upon changes in settlement receivables and the timing of payments related to settlement liabilities. As such, our cash and cash equivalents can change substantially based upon the timing of our receipt of payments for settlement receivables and payments we make to customers for our settlement liabilities. We present Net Cash Available as management monitors this amount in connection with its forecasting of cash flows and future cash requirements.
A reconciliation of the Company’s cash and cash equivalents per GAAP to Net Cash Position and Net Cash Available is included in the Unaudited Reconciliation of Cash and Cash Equivalents to Net Cash Position and Net Cash Available provided at the end of this release.
We define Total Net Debt as total principal face value of debt outstanding, the most directly comparable GAAP measure, less cash and cash equivalents or $50 million, whichever is smaller. Total Net Debt Leverage Ratio, as used herein, represents Total Net Debt divided by Adjusted EBITDA for the trailing twelve-month period. We present Total Net Debt and Total Net Debt Leverage Ratio as management monitors these items in evaluating our overall liquidity, financial flexibility and leverage, as well as our financial position relative to our credit agreements. Management believes that investors find these useful in evaluating the Company’s overall liquidity.
Cautionary Note Regarding Forward-Looking Statements
This press release contains “forward-looking statements” as defined in the U.S. Private Securities Litigation Reform Act of 1995. In this context, forward-looking statements often address our expected future business and financial performance, and often contain words such as “goal,” “target,” “future,” “estimate,” “expect,” “anticipate,” “intend,” “plan,” “believe,” “seek,” “project,” “may,” “should,” or “will” and similar expressions to identify forward-looking statements. These statements are based upon management’s current expectations, assumptions and estimates and are not guarantees of timing, future events or performance. Actual results may differ materially from those contemplated in these statements, due to risks and uncertainties. Examples of forward-looking statements include, among others, statements the Company makes regarding (a) its ability to execute on key initiatives and deliver ongoing improvements; accelerate Free Cash Flow generation and improve the Company’s capital structure; integrate acquisitions and achieve future growth; drive growth of the gaming operations installed base and DWPU; continue expanding the portions of the gaming floor the Company’s games address; and create incremental value for its shareholders; and (b) its guidance related to 2019 financial and operational metrics, including net income; Adjusted EBITDA; Free Cash Flow; revenues; unit sales of Gaming units and FinTech equipment; gaming operations placements, size of the installed base and DWPU; the contribution from acquisitions; anticipated levels of capital expenditures and placement fees; depreciation and amortization expense; interest expense; income tax benefit, including cash tax payments; cash interest payments; non-cash stock compensation expense; and accretion of contract rights.
The forward-looking statements in this press release are subject to a variety of risks and uncertainties, including those set forth under the heading “Risk Factors” and “Management’s Discussion and Analysis of Financial Condition and Results of Operations” in our periodic reports filed with the Securities and Exchange Commission (the “SEC”), including, without limitation, our Annual Report on Form 10-K for the year ended December 31, 2018 , and are based on information available to us on the date hereof.
These cautionary statements qualify our forward-looking statements and you are cautioned not to place undue reliance on these forward-looking statements. Any forward-looking statement contained herein speaks only as of the date, today November 5, 2019, on which it is made, and we do not intend, and assume no obligation, to update or revise any forward-looking statements, whether as a result of new information, future events or otherwise.
This press release should be read in conjunction with the Form 10-Q to which it relates, and with the information included in our other press releases, reports and other filings with the SEC. Understanding the information contained in these filings is important in order to fully understand our reported financial results and our business outlook for future periods.
About Everi
Everi (NYSE: EVRI) is a leading supplier of imaginative entertainment and trusted technology solutions for the casino, interactive, and gaming industry. With a focus on both customers and players, the Company develops entertaining games and gaming machines, gaming systems and services, and is the preeminent and most comprehensive provider of core financial products and services, player loyalty tools and applications, and intelligence and regulatory compliance solutions. Everi’s mission is to provide casino operators with games that facilitate memorable player experiences, offer seamless and secure financial transactions for casinos and their patrons, and deliver software tools and applications to improve casino operations efficiencies and fulfill regulatory compliance requirements. Everi provides these products and services in its effort to help make customers successful. For more information, please visit www.everi.com, which is updated regularly with financial and other information about the Company.
Contacts
Investor Relations
Everi Holdings Inc.
William Pfund
VP, Investor Relations
702-676-9513 or [email protected]
JCIR
Richard Land, James Leahy
212-835-8500 or [email protected]
| EVERI HOLDINGS INC. AND SUBSIDIARIES | ||||||||||||||||
| UNAUDITED CONDENSED CONSOLIDATED STATEMENTS OF INCOME AND | ||||||||||||||||
| COMPREHENSIVE INCOME | ||||||||||||||||
| (In thousands, except earnings per share amounts) | ||||||||||||||||
| Three Months Ended September 30, | Nine Months Ended September 30, | |||||||||||||||
| 2019 | 2018 | 2019 | 2018 | |||||||||||||
| Revenues | ||||||||||||||||
| Games revenues | ||||||||||||||||
| Gaming operations | $ | 48,515 | $ | 43,540 | $ | 138,377 | $ | 126,618 | ||||||||
| Gaming equipment and systems | 19,584 | 21,068 | 66,083 | 63,499 | ||||||||||||
| Gaming other | 1,174 | 1,231 | 1,619 | 1,887 | ||||||||||||
| Games total revenues | 69,273 | 65,839 | 206,079 | 192,004 | ||||||||||||
| FinTech revenues | ||||||||||||||||
| Cash access services | 43,152 | 39,406 | 123,680 | 117,364 | ||||||||||||
| Equipment | 10,188 | 7,155 | 25,051 | 16,338 | ||||||||||||
| Information services and other | 11,956 | 7,930 | 33,240 | 24,307 | ||||||||||||
| FinTech total revenues | 65,296 | 54,491 | 181,971 | 158,009 | ||||||||||||
| Total revenues | 134,569 | 120,330 | 388,050 | 350,013 | ||||||||||||
| Costs and expenses | ||||||||||||||||
| Games cost of revenues | ||||||||||||||||
| Gaming operations | 4,942 | 4,607 | 12,792 | 13,000 | ||||||||||||
| Gaming equipment and systems | 11,126 | 11,907 | 37,087 | 34,693 | ||||||||||||
| Gaming other | 1,117 | 1,059 | 1,464 | 1,618 | ||||||||||||
| Games total cost of revenues | 17,185 | 17,573 | 51,343 | 49,311 | ||||||||||||
| FinTech cost of revenues | ||||||||||||||||
| Cash access services | 4,112 | 2,234 | 9,777 | 6,910 | ||||||||||||
| Equipment | 5,957 | 3,846 | 14,884 | 9,786 | ||||||||||||
| Information services and other | 1,024 | 949 | 2,952 | 3,146 | ||||||||||||
| FinTech total cost of revenues | 11,093 | 7,029 | 27,613 | 19,842 | ||||||||||||
| Operating expenses | 37,631 | 35,419 | 111,446 | 105,176 | ||||||||||||
| Research and development | 8,196 | 5,407 | 22,399 | 14,313 | ||||||||||||
| Depreciation | 16,015 | 17,304 | 46,062 | 43,830 | ||||||||||||
| Amortization | 17,156 | 16,088 | 51,143 | 48,943 | ||||||||||||
| Total costs and expenses | 107,276 | 98,820 | 310,006 | 281,415 | ||||||||||||
| Operating income | 27,293 | 21,510 | 78,044 | 68,598 | ||||||||||||
| Other expenses | ||||||||||||||||
| Interest expense, net of interest income | 19,297 | 20,160 | 60,130 | 62,589 | ||||||||||||
| Loss on extinguishment of debt | — | — | — | 166 | ||||||||||||
| Total other expenses | 19,297 | 20,160 | 60,130 | 62,755 | ||||||||||||
| Income before income tax | 7,996 | 1,350 | 17,914 | 5,843 | ||||||||||||
| Income tax benefit | (1,319 | ) | (719 | ) | (2,747 | ) | (2,310 | ) | ||||||||
| Net income | 9,315 | 2,069 | 20,661 | 8,153 | ||||||||||||
| Foreign currency translation | (658 | ) | (9 | ) | (189 | ) | (744 | ) | ||||||||
| Comprehensive income | $ | 8,657 | $ | 2,060 | $ | 20,472 | $ | 7,409 | ||||||||
| Earnings per share | ||||||||||||||||
| Basic | $ | 0.13 | $ | 0.03 | $ | 0.29 | $ | 0.12 | ||||||||
| Diluted | $ | 0.12 | $ | 0.03 | $ | 0.27 | $ | 0.11 | ||||||||
| Weighted average common shares outstanding | ||||||||||||||||
| Basic | 72,251 | 69,750 | 71,361 | 69,217 | ||||||||||||
| Diluted | 79,125 | 74,594 | 77,854 | 73,712 | ||||||||||||
EVERI HOLDINGS INC. AND SUBSIDIARIES
UNAUDITED CONDENSED CONSOLIDATED STATEMENTS OF CASH FLOWS
(In thousands)
| Nine Months Ended September 30, | |||||||
| 2019 | 2018 | ||||||
| Cash flows from operating activities | |||||||
| Net income | $ | 20,661 | $ | 8,153 | |||
| Adjustments to reconcile net income to cash provided by operating activities: | |||||||
| Depreciation | 46,062 | 43,830 | |||||
| Amortization | 51,143 | 48,943 | |||||
| Amortization of financing costs and discounts | 2,697 | 3,969 | |||||
| Loss on sale or disposal of assets | 1,375 | 687 | |||||
| Accretion of contract rights | 6,539 | 6,299 | |||||
| Provision for bad debts | 10,010 | 8,342 | |||||
| Deferred income taxes | (3,173 | ) | (2,804 | ) | |||
| Write-down of inventory and fixed assets | 843 | 2,575 | |||||
| Reserve for obsolescence | 1,830 | 1,386 | |||||
| Stock-based compensation | 6,141 | 6,117 | |||||
| Loss on extinguishment of debt | — | 166 | |||||
| Adjustment to certain purchase accounting liabilities | — | (550 | ) | ||||
| Changes in operating assets and liabilities: | |||||||
| Settlement receivables | 26,774 | 1,703 | |||||
| Trade and other receivables | (23,820 | ) | (23,856 | ) | |||
| Inventory | (3,341 | ) | (4,824 | ) | |||
| Other assets | (17,806 | ) | (1,146 | ) | |||
| Settlement liabilities | (34,573 | ) | (12,889 | ) | |||
| Other liabilities | 29,002 | 6,281 | |||||
| Net cash provided by operating activities | 120,364 | 92,382 | |||||
| Cash flows from investing activities | |||||||
| Capital expenditures | (81,642 | ) | (78,545 | ) | |||
| Acquisition | (20,000 | ) | — | ||||
| Proceeds from sale of fixed assets | 56 | 83 | |||||
| Placement fee agreements | (17,102 | ) | (15,300 | ) | |||
| Net cash used in investing activities | (118,688 | ) | (93,762 | ) | |||
| Cash flows from financing activities | |||||||
| Repayments of credit facilities | (25,700 | ) | (6,150 | ) | |||
| Debt issuance costs and discounts | — | (1,276 | ) | ||||
| Proceeds from exercise of stock options | 11,288 | 9,529 | |||||
| Purchase of treasury stock | (1,021 | ) | (57 | ) | |||
| Net cash (used in) provided by financing activities | (15,433 | ) | 2,046 | ||||
| Effect of exchange rates on cash | (1,314 | ) | (432 | ) | |||
| Cash, cash equivalents and restricted cash | |||||||
| Net (decrease) increase for the period | (15,071 | ) | 234 | ||||
| Balance, beginning of the period | 299,181 | 129,604 | |||||
| Balance, end of the period | $ | 284,110 | $ | 129,838 | |||
EVERI HOLDINGS INC. AND SUBSIDIARIES
UNAUDITED RECONCILIATION OF CASH AND CASH EQUIVALENTS
TO NET CASH POSITION AND NET CASH AVAILABLE
(In thousands)
| At September 30, | At December 31, | ||||||
| 2019 | 2018 | ||||||
| Cash available | |||||||
| Cash and cash equivalents | $ | 275,706 | $ | 297,532 | |||
| Settlement receivables | 56,035 | 82,359 | |||||
| Settlement liabilities | (298,490 | ) | (334,198 | ) | |||
| Net Cash Position | 33,251 | 45,693 | |||||
| Undrawn revolving credit facility | 35,000 | 35,000 | |||||
| Net Cash Available | $ | 68,251 | $ | 80,693 | |||
EVERI HOLDINGS INC. AND SUBSIDIARIES
UNAUDITED RECONCILIATION OF NET INCOME TO EBITDA AND ADJUSTED EBITDA AND
TO FREE CASH FLOW
(In thousands)
| Three Months Ended September 30, 2019 | Three Months Ended September 30, 2018 | ||||||||||||||||||||
| Games | FinTech | Total | Games | FinTech | Total | ||||||||||||||||
| Net income | $ | 9,315 | $ | 2,069 | |||||||||||||||||
| Income tax benefit | (1,319 | ) | (719 | ) | |||||||||||||||||
| Interest expense, net of interest income | 19,297 | 20,160 | |||||||||||||||||||
| Operating income (loss) | $ | 3,073 | $ | 24,220 | $ | 27,293 | $ | (746 | ) | $ | 22,256 | $ | 21,510 | ||||||||
| Plus: depreciation and amortization | 28,678 | 4,493 | 33,171 | 29,636 | 3,756 | 33,392 | |||||||||||||||
| EBITDA | $ | 31,751 | $ | 28,713 | $ | 60,464 | $ | 28,890 | $ | 26,012 | $ | 54,902 | |||||||||
| Non-cash stock compensation expense | 602 | 1,379 | 1,981 | 771 | 1,041 | 1,812 | |||||||||||||||
| Accretion of contract rights | 2,221 | — | 2,221 | 2,121 | — | 2,121 | |||||||||||||||
| Adjustment of certain purchase accounting liabilities | — | — | — | — | (550 | ) | (550 | ) | |||||||||||||
| Adjusted EBITDA | $ | 34,574 | $ | 30,092 | $ | 64,666 | $ | 31,782 | $ | 26,503 | $ | 58,285 | |||||||||
| Cash paid for interest | (12,528 | ) | (12,086 | ) | |||||||||||||||||
| Cash paid for capital expenditures | (35,959 | ) | (20,609 | ) | |||||||||||||||||
| Cash paid for placement fees | (5,454 | ) | (5,183 | ) | |||||||||||||||||
| Cash paid for income taxes, net of refunds | 362 | (124 | ) | ||||||||||||||||||
| Free Cash Flow | $ | 11,087 | $ | 20,283 | |||||||||||||||||
EVERI HOLDINGS INC. AND SUBSIDIARIES
UNAUDITED RECONCILIATION OF NET INCOME TO EBITDA AND ADJUSTED EBITDA AND
TO FREE CASH FLOW
(In thousands)
| Nine Months Ended September 30, 2019 | Nine Months Ended September 30, 2018 | |||||||||||||||||||
| Games | FinTech | Total | Games | FinTech | Total | |||||||||||||||
| Net income | $ | 20,661 | $ | 8,153 | ||||||||||||||||
| Income tax benefit | (2,747 | ) | (2,310 | ) | ||||||||||||||||
| Loss on extinguishment of debt | — | 166 | ||||||||||||||||||
| Interest expense, net of interest income | 60,130 | 62,589 | ||||||||||||||||||
| Operating income | $ | 8,729 | $ | 69,315 | $ | 78,044 | $ | 5,914 | $ | 62,684 | $ | 68,598 | ||||||||
| Plus: depreciation and amortization | 83,927 | 13,278 | 97,205 | 80,280 | 12,493 | 92,773 | ||||||||||||||
| EBITDA | $ | 92,656 | $ | 82,593 | $ | 175,249 | $ | 86,194 | $ | 75,177 | $ | 161,371 | ||||||||
| Non-cash stock compensation expense | 1,895 | 4,246 | 6,141 | 2,075 | 4,042 | 6,117 | ||||||||||||||
| Accretion of contract rights | 6,539 | — | 6,539 | 6,299 | — | 6,299 | ||||||||||||||
| Adjustment of certain purchase accounting liabilities | — | — | — | — | (550 | ) | (550 | ) | ||||||||||||
| Write-off of inventory and fixed assets | 843 | — | 843 | 2,575 | — | 2,575 | ||||||||||||||
| Asset acquisition expense and other non-recurring professional fees | 484 | 790 | 1,274 | — | — | — | ||||||||||||||
| Adjusted EBITDA | $ | 102,417 | $ | 87,629 | $ | 190,046 | $ | 97,143 | $ | 78,669 | $ | 175,812 | ||||||||
| Cash paid for interest | (52,077 | ) | (54,930 | ) | ||||||||||||||||
| Cash paid for capital expenditures | (81,642 | ) | (78,545 | ) | ||||||||||||||||
| Cash paid for placement fees | (17,102 | ) | (15,300 | ) | ||||||||||||||||
| Cash paid for income taxes, net of refunds | 69 | (346 | ) | |||||||||||||||||
| Free Cash Flow | $ | 39,294 | $ | 26,691 | ||||||||||||||||
EVERI HOLDINGS INC. AND SUBSIDIARIES
UNAUDITED CALCULATION OF TOTAL NET DEBT LEVERAGE RATIO
(In thousands, except for ratio)
| Trailing Twelve Months Ended | ||||||||
| September 30, 2019 | September 30, 2018 | |||||||
| Net income (loss) | $ | 24,864 | $ | (16,896 | ) | |||
| Income tax benefit | (10,147 | ) | (26,097 | ) | ||||
| Loss on extinguishment of debt | — | 37,301 | ||||||
| Interest expense, net of interest income | 80,542 | 92,419 | ||||||
| Operating income | $ | 95,259 | $ | 86,727 | ||||
| Plus: depreciation and amortization | 130,902 | 122,709 | ||||||
| EBITDA | $ | 226,161 | $ | 209,436 | ||||
| Non-cash stock compensation expense | 7,274 | 7,404 | ||||||
| Accretion of contract rights | 8,661 | 8,274 | ||||||
| Adjustment of certain purchase accounting liabilities | — | (550 | ) | |||||
| Write-off of inventory and fixed assets | 843 | 2,575 | ||||||
| Asset acquisition expense and other non-recurring professional fees | 1,682 | — | ||||||
| Adjusted EBITDA | $ | 244,621 | $ | 227,139 | ||||
| Principal face value of debt outstanding (1) | $ | 1,157,000 | $ | 1,184,750 | ||||
| Less: cash and cash equivalents (2) | 50,000 | 50,000 | ||||||
| Total Net Debt | $ | 1,107,000 | $ | 1,134,750 | ||||
| Total Net Debt Leverage Ratio | 4.5x | 5.0x | ||||||
(1) Principal face value of outstanding senior secured term loan facility, the senior secured revolving credit facility and senior unsecured notes.
(2) The Company nets the lesser of cash and cash equivalents or $50 million against debt outstanding, as provided in the Company’s Credit Facility.
RECONCILIATION OF PROJECTED NET INCOME TO PROJECTED EBITDA
AND PROJECTED ADJUSTED EBITDA AND TO PROJECTED FREE CASH FLOW
FOR THE YEAR ENDING DECEMBER 31, 2019
(In thousands)
| 2019 Adjusted EBITDA Guidance Range(1) | |||||||
| Low | High | ||||||
| Projected net income | $ | 25,000 | $ | 30,000 | |||
| Projected income tax benefit | (4,000 | ) | (5,000 | ) | |||
| Projected interest expense, net of interest income | 80,000 | 79,000 | |||||
| Projected operating income | $ | 101,000 | $ | 104,000 | |||
| Projected depreciation and amortization | 130,000 | 133,000 | |||||
| Projected EBITDA | $ | 231,000 | $ | 237,000 | |||
| Projected non-cash stock compensation expense | 9,000 | 8,000 | |||||
| Projected accretion of contract rights | 9,000 | 8,000 | |||||
| Projected asset acquisition expense and other non-recurring professional fees | 3,000 | 2,000 | |||||
| Projected Adjusted EBITDA | $ | 252,000 | $ | 255,000 | |||
| Projected cash paid for interest | (79,000 | ) | (77,000 | ) | |||
| Projected cash paid for capital expenditures | (113,000 | ) | (116,000 | ) | |||
| Projected cash paid for placement fees | (17,000 | ) | (17,000 | ) | |||
| Projected cash paid for income taxes, net of refunds | (1,000 | ) | — | ||||
| Projected Free Cash Flow | $ | 42,000 | $ | 45,000 | |||
(1) All figures presented are projected estimates for the year ending December 31, 2019.
-

 Gambling in the USA7 days ago
Gaming Americas Weekly Roundup – August 25-31
-

 Balkans7 days ago
GoldenRace is opening up the Bulgarian market with Inbet
-

 Balkans7 days ago
CT Gaming Secures Certification for its Latest Multigame – Diamond King 5
-

 Latest News7 days ago
Octoplay advances on its European growth strategy by partnering with Evoke Group in the UK and Denmark
-
 Asia7 days ago
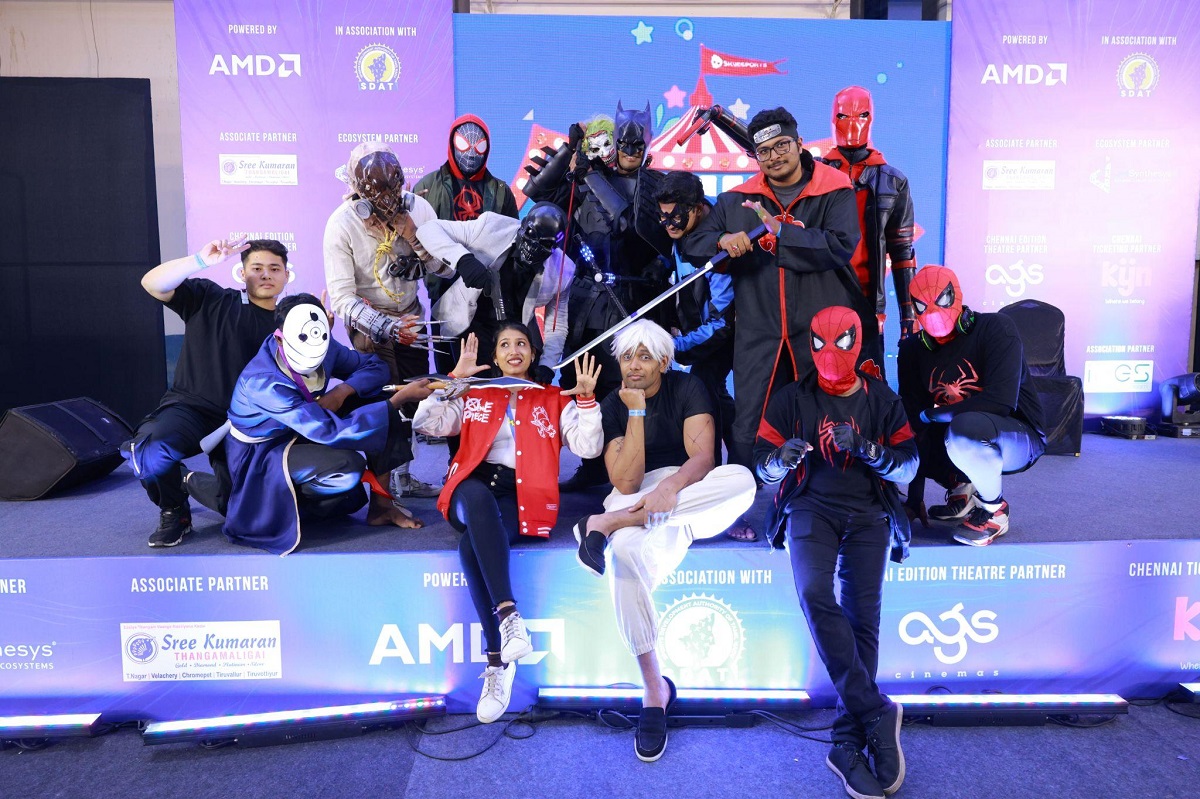
Skyesports Wraps Up Gaming Thiruvizha – Chennai Edition With 17,000+ Fans in Attendance
-

 Baltics7 days ago
CT Interactive Expands its Certified Game Portfolio in Latvia
-

 Latest News7 days ago
Unearth ancient treasures in Relax Gaming hit Bill & Coin 2: Mummy Mischief
-

 Latest News7 days ago
Fire Toad 2 leaps into action with sizzling new upgrades
