Latest News
INTRALOT Announces First Quarter 2021 Financial Results

INTRALOT SA (RIC: INLr.AT, Bloomberg: INLOT GA), an international gaming solutions and operations leader, announces its financial results for the three-month period ended March 31st, 2021, prepared in accordance with IFRS.
Group Revenue at €102.0m in 1Q21 (+9.3% y-o-y).
EBITDA in 1Q21 at €24.4m (+55.4% y-o-y), while Adjusted EBITDA at €20.8m (+56.4% y-o-y).
NIATMI (Net Income After Tax and Minority Interest) from continuing operations at €-7.3m, improved by 57.8% compared to a year ago.
North America operations, under Intralot Inc., achieved significant y-o-y growth (Revenue +21.8%, EBITDA +81.8%).
Group OPEX in 1Q21 is better by 8.3% y-o-y, with Greek entities OPEX lower by 25.7% y-o-y, without taking into consideration the capital structure optimization expenses.
Operating Cash Flow at €21.6m in 1Q21 (+127.4% y-o-y).
Group Net CAPEX in 1Q21 was €2.9m, lower by 48.2% compared to a year ago.
Group Cash at the end of 1Q21 at €90.6m.
Net Debt at €643.7m at the end of 1Q21.
The COVID-19 pandemic impact for 1Q21 has been restrained in the vicinity of €1.5m at Group’s EBITDA level.
In May 2021, INTRALOT announced the sale of its 80% stake in “Intralot do Brasil”, to SAGA, the only other shareholder of Intralot do Brasil, holding 20% of the company, for a total cash consideration of €0.7m. INTRALOT will continue to provide its gaming technology to Intralot do Brasil following closing of the transaction.
Also in May 2021, INTRALOT announced that its subsidiary in The Netherlands INTRALOT BENELUX BV, in co-operation with the Nederlandse Loterij, completed the transition of the operator’s full gaming portfolio enabled by the innovative LotosX platform, and rolled out 4,300 Photon terminals along with its robust signage solution empowering further the retail channel of Nederlandse Loterij’s Lottery games and Sports Betting offering.
Group Headline Figures
| (in € million) | 1Q21 | 1Q20 | % | LTM | ||
| Change | ||||||
| Revenue (Turnover) | 102.0 | 93.3 | 9.3% | 373.5 | ||
| GGR | 80.5 | 74.3 | 8.3% | 299.1 | ||
| OPEX1 | -23.2 | -25.3 | -8.3% | -93.1 | ||
| EBITDA2 | 24.4 | 15.7 | 55.4% | 74.9 | ||
| EBITDA Margin (% on | 23.9% | 16.8% | +7.1pps | 20.1% | ||
| Revenue) | ||||||
| EBITDA Margin (% on GGR) | 30.3% | 21.1% | +9.2pps | 25.0% | ||
| Adjusted EBITDA3 | 20.8 | 13.3 | 56.4% | 63.3 | ||
| Capital Structure | -5.0 | -0.3 | – | -11.5 | ||
| Optimization expenses | ||||||
| D&A | -16.0 | -18.2 | -12.1% | -66.3 | ||
| EBT | -3.4 | -14.9 | 77.2% | -82.6 | ||
| EBT Margin (%) | -3.3% | -16.0% | +12.7pps | -22.1% | ||
| NIATMI from continuing | -7.3 | -17.3 | 57.8% | -94.1 | ||
| operations | ||||||
| Total Assets | 612.1 | 755.3 | – | – | ||
| Gross Debt | 734.3 | 753.1 | – | – | ||
| Net Debt | 643.7 | 611.1 | – | – | ||
| Operating Cash Flow from | 21.6 | 9.5 | 127.4% | 49.8 | ||
| total operations | ||||||
| Net CAPEX | -2.9 | -5.6 | -48.2% | -33.3 | ||
INTRALOT Chairman & CEO Sokratis P. Kokkalis noted:
“First quarter results show strong Revenue and EBITDA growth, driven by robust operational performance and successful implementation of cost containment measures, while maintaining a strong cash position. At the same time, we continue to sharpen our focus on strategic markets with higher margins, launch new operations, such as Croatia, and roll out our new product portfolio, overall pointing to a very healthy operational performance for 2021.”
- OPEX presented exclude the capital structure optimization expenses.
- The Group defines “EBITDA” as “Operating Profit/(Loss) before tax” adjusted for the figures “Profit/(loss) from equity method consolidations”, “Profit/(loss) to net monetary position”, “Exchange Differences”, “Interest and related income”, “Interest and similar expenses”, “Income/(expenses) from participations and investments”, “Write-off and impairment loss of assets”, “Gain/(loss) from assets disposal”, “Reorganization costs” and “Assets’ depreciation and amortization”.
- Calculated as Proportionate EBITDA of fully consolidated entities including EBITDA from equity investment in Taiwan.
OVERVIEW OF RESULTS
REVENUE
Reported consolidated revenue posted an increase compared to 1Q20, leading to total revenue for the three-month period ended March 31st, 2021, of €102.0m (+9.3%).
- Lottery Games was the largest contributor to our top line, comprising 63.0% of our revenue, followed by Sports Betting contributing 19.1% to Group turnover. VLTs represented 8.7% and Technology contracts accounted as well for 8.7% of Group turnover, while Racing constituted the 0.5% of total revenue of 1Q21.
- Reported consolidated revenue for the three-month period is higher by €8.7m year over year. The main factors that drove top line performance per Business Activity are:
- €+1.3m (+3.9%) from our Licensed Operations (B2C) activity line, with the increase attributed mainly to higher revenue in:
- Malta (€+2.8m), with the variance attributable mainly to the COVID-19 impact at the end of the first quarter of 2020.
The increase in our Licensed Operations activity line was partially mitigated by the lower performance in:
- other Licensed Operations (referring to Brazil and Argentina), which dropped by €-1.5m, impacted mainly by the FX currency translation.
- €+5.3m (+65.4%) from our Management (B2B/ B2G) contracts activity line with the variance driven by:
- the surplus from our Turkish operations (€+3.1m), driven by Bilyoner’s improved top line performance, favored by the strong growth of the online market. In 1Q21, the local Sports Betting market expanded close to 2.0 times y-o-y, with the online segment representing close to 92% of the market at the end of 1Q21. Performance in Euro terms was partially mitigated by the headwinds in Turkish lira (32.3% Euro appreciation versus a year ago – in YTD average terms),
- the launch of US Sports Betting in Montana and Washington, D.C. in late 2020 (€+1.3m), and
- Morocco’s (€+0.9m or +31.2% y-o-y) improved performance, due to the COVID-19 impact in late 1Q20.
- €+2.1m (+4.0%) from our Technology and Support Services (B2B/ B2G) activity line, with the increase attributed mainly to:
- our US operations’ increased revenue (€+5.5m), mainly driven by the strong growth in our Lottery operations, while further boosted by a significant jackpot in January 2021, despite the effect from the adverse USD movement (9.1% Euro appreciation versus a year ago — in YTD average terms) and the lower merchandise sales in the current period.
The increase in our Technology and Support Services activity line was partially mitigated by the lower performance in:
- The Netherlands (€-1.2m), impacted by the revised commercial terms which affected half of the first quarter of 2020 vs. full quarter effect in 2021,
- Australia (€-1.1m), driven mainly by one-off merchandise sales in 1Q20, as well as the phasing-out of COVID-19 impact, while partially offset by the favorable currency movement, and
- sales from other jurisdictions (€-1.1m), impacted mainly by lower merchandise sales in the current period and the COVID-19 impact.
- Constant currency basis: In 1Q21, revenue — net of the negative FX impact of €13.2m — reached €115.2m (+23.5% y-o-y).
GROSS GAMING REVENUE & Payout
- Gross Gaming Revenue (GGR) from continuing operations concluded at €80.5m in 1Q21, posting an increase of 8.3% (or €+6.2m) year over year, attributable to:
- the increase in the non-payout related GGR (€+7.7m vs. 1Q20), driven mainly by the increased top line contribution of our US operations, as well as the improved performance of Bilyoner in the current period.
The GGR increase was partially counterbalanced by:
– the drop in our payout related GGR (-10.9% y-o-y or €-1.5m), driven mainly by the higher average payout ratio across all licensed operations in 1Q21 and especially in Malta, combined with the adverse FX impact from our licensed operations in Latin America (+2.8% y-o-y on wagers from licensed operations4). 1Q21 Average Payout Ratio5 increased by 5.5pps vs. LY (64.0% vs. 58.5%), affected mainly by the higher weighted contribution from our operations in Malta.
- Constant currency basis: In 1Q21, GGR — net of the negative FX impact of €10.1m — reached €90.6m (+21.9% y-o-y).
OPERATING EXPENSES6 & EBITDA7
- Total Operating Expenses decreased by €2.1m (or 8.3%) in 1Q21 (€23.2m vs. €25.3m in 1Q20). The variance is largely driven by the lower operating expenses across many key regions, such as the US and Morocco, and especially in the HQ, following cost savings and COVID-19 mitigation actions. The decrease was further supported by lower D&A in the current period, while it was only partially offset by the higher advertising costs in Bilyoner.
- Other Operating Income from continuing operations concluded at €5.5m, presenting an increase of 52.8% y-o-y (or €+1.9m), driven by higher equipment lease income in the USA.
- EBITDA, from continuing operations, amounted to €24.4m in 1Q21, posting an increase of 4% (or €+8.7m) compared to the 1Q20 results from continuing operations. 1Q21 Organic performance8 was boosted by the significant growth of our US operations in both Lottery and the new Sports Betting stream, Bilyoner’s improved performance and the operating expenses containments across many jurisdictions. The EBITDA increase was partially counterbalanced by Malta’s higher average payout ratio in 1Q21, a one-off revenue recognition in Australia in 1Q20, the revised commercial terms in Netherlands, as well as the adverse FX impact8 of currencies movement across many key markets (mainly US and Turkey).
- Licensed Operations Revenue also include a small portion of non-Payout related revenue, i.e., value-added services, which totaled €0.8m and €0.4m for 1Q21 and 1Q20, respectively.
- Payout ratio calculation excludes the IFRS 15 impact for payments to customers.
- Operating Expenses analysis excludes expenditures related to capital structure optimization.
- EBITDA analysis excludes Depreciation & Amortization, and expenditures related to capital structure optimization.
- CPI adjusted for Turkey and Argentina (proxy).
- On a yearly basis, EBITDA margin on sales improved to 23.9%, compared to 16.8% in 1Q20 (+7.1pps), as a result of revenue growth (mainly in the US and Turkey), combined with operating expenses containments across many key regions (mainly in HQ, US and Morocco).
- LTM EBITDA rose to €74.9m, up by 13.1% vs. FY20.
- Constant currency basis: In 1Q21, EBITDA, net of the negative FX impact of €3.9m, reached €28.3m (+80.3% y-o-y).
EBT / NIATMI
- EBT in 1Q21 totaled €-3.4m, compared to €-14.9m in 1Q20, with the key drivers of the improvement being:
- the impact of the increased EBITDA (€+8.7m vs. 1Q20), as described above,
- the better FX results (€+4.2m vs. 1Q20), as a result of the USD and other currencies movement against Euro, as well as the positive effect from the reclassification of FX reserves to Income Statement applying IFRS 10, and
- the decreased D&A (€+2.2m), due to increased impairments in the previous periods.
With the increase at EBT level being partially offset by:
– the higher capital structure optimization expenses in 1Q21 (€-4.7m).
- Constant currency basis: In 1Q21 EBΤ, adjusted for the FX impact, reached €+1.0m, from €-14.1m in 1Q20.
- NIATMI from continuing operations in 1Q21 concluded at €-7.3m compared to €-17.3m in NIATMI from total operations in 1Q21 amounted to €-8.2m (improved by €9.4m vs. a year ago), including the performance of the discontinued operations in Bulgaria and Peru.
- Constant currency basis: NIATMI (total operations) in 1Q21, on a constant currency basis, reached €-10.3m from €-17.4m in 1Q20.
CASH-FLOW
- Operating Cash-flow in 1Q21 amounted to €21.6m, increased by €12.1m, compared to 1Q20. Excluding the operating cash-flow contribution of our discontinued operations (mainly Bulgaria) and the capital structure optimization expenses paid, the cash-flow from operating activities is higher by €15.9m vs. a year ago and is largely driven by the positive variance in Income Taxes paid (€+12.2m), attributed to Income Tax returns during the current period vs. payments in 1Q20, and the higher recorded EBITDA y-o-y from continuing operations (€+8.7m), while partially offset by the adverse working capital movement of €-5.5m (€-7.3m in 1Q21, vs. €-1.8m in 1Q20).
- Adjusted Free Cash Flow9 in 1Q21 increased by €24.4m to €4.1m, compared to €-20.3m a year The main contributors to this variance were the positive swing in the Income Taxes Paid (€+12.2m), following an income tax return in 1Q21, the higher recorded EBITDA (€+8.7m y-o-y), and the lower Net Dividends paid (€+2.5m), driven mainly by Inteltek’s dividend paid in 1Q20 as part of settlement procedures after its contract discontinuation. Excluding Parent company tax audit payments and returns, as well as Inteltek’s contract discontinuation impact in the previous period, 1Q21 Adjusted Free Cash Flow stands at €-1.1m, or €+8.3m above 1Q20 levels.
- Calculated as EBITDA – Maintenance CAPEX – Cash Taxes – Net Cash Finance Charges (excluding refinancing charges – Net Dividends Paid; all finance metrics exclude the impact of discontinued operations.
- Net CAPEX in 1Q21 was €2.9m, compared to €5.6m in 1Q20, significantly decreased following the completion of prior years’ investments and projects. Headline CAPEX items in 1Q21 include €0.9m towards R&D and project pipeline delivery, and €0.9m in the US. All other net additions amount to €1.1m for 1Q21. Maintenance CAPEX accounted for €0.8m, or 28.0% of the overall capital expenditure in 1Q21, from €1.6m or 28.1% in 1Q20.
- Net Debt, as of March 31st, 2021, stood at €643.7m, decreased by €7.4m compared to December 31st, 2020. The Net Debt movement was impacted primarily by the Net Investments (€-13.3m, referring mainly to Intralot de Peru sale impact), the bonds IFRS treatment positive effect (€-9.3m), as well as an income tax return in the first quarter of 2021 related to the Parent Company tax audit payments of the previous periods (€-5.2m). The Net Debt decrease was only partially offset by the Restricted Bank Deposits for the period (€+3.2m), the payments towards Capital Structure Optimization (€+3.1m), and the investments towards the growth of our business, mainly for our projects in the US and Croatia (€+1.9m). Normal course of business in the Net Debt movement reflects March coupon payments and the adverse Working Capital, that fully offset the positive Operating Cash Flows.
CORONAVIRUS PANDEMIC IMPACT UPDATE
The economic fallout from COVID-19 continued to affect business activities in the beginning of 2021, and restrictions in most of the regions across the world were still enforced to cope with the spread of the pandemic. However, as vaccinations are progressing, governments have loosened COVID-19 measures after months of lockdowns, and gradually re-opened economic activities.
Gaming market in most of the regions where we operate has started to improve, while US Lottery market shows high degree of resilience. Based on the current performance of our operations in the first months of 2021 and the actions undertaken by most of our subsidiaries, no significant EBITDA impact is expected post 1Q21 from the pandemic. In any case, the scale and magnitude of COVID-19 impact for 2021 is continuously assessed and all containment measures assumed in 2020 remain intact and have been enhanced in order to absorb the potential impact in the financial results of 2021. The extent to which the COVID-19 pandemic may impact the financial performance in 2021 will depend on future development of the pandemic and the efficiency of the actions taken by the governments. This uncertainty will require us to continually adapt our strategy and initiatives and continuously assess the situation.
The health and safety of our team remains our top priority. With this in mind, we have immediately complied with all measures imposed by local governments and used technology in order to immediately enable a substantive majority of our personnel to work and collaborate remotely, without affecting the performance and quality standards of the Group.
9
RECENT/ SIGNIFICANT COMPANY DEVELOPMENTS
- On January 14th, 2021, the Company announced that OPAP exercised its two-year extension option of the contract with INTRALOT for the continuation of the collaboration of the two companies in the field of numerical lotteries and services from August 2021 to July 2023.
- On February 8th, 2021, INTRALOT announced that it has reached a binding agreement with Nexus Group in Peru to sell its entire stake of 20% in Intralot de Peru SA, an associate of INTRALOT Group, which was consolidated through the Equity method, for a cash consideration of USD 21.0m. In addition, the Company signed a three-year extension of its current contract with Intralot de Peru SA through 2024, to continue to provide its gaming technology and support services. The transaction was completed on February 24th, 2021, with the net cash consideration, after taxes and transaction expenses, amounting to USD 16.2m.
- On March 23rd, 2021, INTRALOT announced the amendment of the contract of INTRALOT Maroc, a subsidiary of the INTRALOT Group acting as games operator in Morocco, with La Marocaine Des Jeux et des Sports (MDJS), a state lottery offering sports betting and other games of chance in Morocco, which was signed in June 2019. According to this amendment, counterparties agree to reduce the duration of the contract, which was initially effective for an 8-year term, ending 31/12/2022.
- On May 14th, 2021, INTRALOT announced that it has reached a binding agreement with “SAGA CONSULTORIA E REPRESENTAÇÕES COMERCIAIS E EMPRESARIAIS” (“SAGA”) in Brazil to sell its entire stake in “Intralot do Brasil Comércio de Equipamentos e Programas de Computador LTDA” (“Intralot do Brasil”), representing 80% of the company’s voting capital. SAGA is the only other shareholder of Intralot do Brasil holding 20% of the company. INTRALOT will continue to provide its gaming technology to Intralot do Brasil following closing of the transaction. The total cash consideration for the stake sale amounts to €0.7m.
- On May 26th, 2021, INTRALOT announced that its subsidiary in The Netherlands INTRALOT BENELUX BV, in co-operation with the Nederlandse Loterij, completed the transition of the operator’s full gaming portfolio enabled by the innovative LotosX platform. Additionally,
INTRALOT has rolled out 4,300 Photon terminals along with its robust signage solution empowering further the retail channel of Nederlandse Loterij’s Lottery games and Sports Betting offering.
10
APPENDIX
Performance per Business Segment10
YTD Performance
Performance per Geography
Revenue Breakdown
| (in € million) | 1Q21 | 1Q20 | % | ||
| Change | |||||
| Europe | 34.4 | 39.0 | -11.8% | ||
| Americas | 55.0 | 49.7 | 10.7% | ||
| Other | 16.8 | 14.0 | 20.0% | ||
| Eliminations | -4.2 | -9.4 | – | ||
| Total Consolidated Sales | 102.0 | 93.3 | 9.3% |
Gross Profit Breakdown
| (in € million) | 1Q21 | 1Q20 | % | ||
| Change | |||||
| Europe | -1.8 | 2.5 | – | ||
| Americas | 14.4 | 9.1 | 58.2% | ||
| Other | 14.2 | 9.8 | 44.9% | ||
| Eliminations | -0.7 | -2.3 | – | ||
| Total Consolidated Gross Profit | 26.1 | 19.1 | 36.6% |
- Part of the US revenue that concerns SB management, has been included under the category “Game Management”. The rest of the US revenue is included under the “Technology” business segment.
11
| Gross Margin Breakdown | ||||||
| % | ||||||
| 1Q21 | 1Q20 | |||||
| Change | ||||||
| Europe | -5.2% | 6.4% | -11.6pps | |||
| Americas | 26.2% | 18.3% | +7.9pps | |||
| Other | 84.5% | 70.0% | +14.5pps | |||
| Total Consolidated Gross Margin | 25.6% | 20.5% | +5.1pps | |||
INTRALOT Parent Company results
- Revenue for the period decreased by 55.3%, to €4.6m, with the decrease attributable mainly to one-off equipment sales in 1Q20, as well as lower rendering of services towards the Group’s subsidiaries in the current period.
- EBITDA shaped at €-4.5m from €-2.4m in 1Q20, variance affected mainly by the revenue decrease, while partially offset by the containments in the Company’s operating expenses.
- Earnings after Taxes (EAT) at €-0.1m from €-10.2m in 1Q20.
| (in € million) | 1Q21 | 1Q20 | % | LTM | ||||
| Change | ||||||||
| Revenue | 4.6 | 10.3 | -55.3% | 42.0 | ||||
| Gross Profit | -3.1 | 0.1 | – | 12.3 | ||||
| Other Operating Income | – | – | – | 0.2 | ||||
| OPEX11 | -5.1 | -6.9 | -26.1% | -25.7 | ||||
| EBITDA11 | -4.5 | -2.4 | -87.5% | 0.7 | ||||
| EAT | -0.1 | -10.2 | 99.0% | -30.5 | ||||
| CAPEX (paid) | -0.5 | -1.9 | -73.7% | -6.4 |
- Operating Expenses and EBITDA presented exclude the expenditures related to capital structure optimization.
12
SUMMARY OF FINANCIAL STATEMENTS
Group Statement of Comprehensive Income
| (in € million) | 1Q21 | 1Q20 | % | LTM | |||||||||
| Change | |||||||||||||
| Revenue | 102.0 | 93.3 | 9.3% | 373.5 | |||||||||
| Gross Profit | 26.1 | 19.1 | 36.6% | 82.3 | |||||||||
| Other Operating Income | 5.5 | 3.6 | 52.8% | 19.5 | |||||||||
| OPEX | -23.2 | -25.3 | -8.3% | -93.1 | |||||||||
| EBITDA | 24.4 | 15.7 | 55.4% | 74.9 | |||||||||
| Margin | 23.9% | 16.8% | +7.1pps | 20.1% | |||||||||
| Capital Structure Optimization | -5.0 | -0.3 | – | -11.5 | |||||||||
| expenses | |||||||||||||
| D&A | -16.0 | -18.2 | -12.1% | -66.3 | |||||||||
| EBIT | 3.4 | -2.9 | – | -2.8 | |||||||||
| Interest expense (net) | -11.8 | -12.0 | 1.7% | -48.2 | |||||||||
| Exchange differences | 3.7 | -0.5 | – | -5.4 | |||||||||
| Other | 1.3 | 0.5 | 160.0% | -26.2 | |||||||||
| EBT | -3.4 | -14.9 | 77.2% | -82.6 | |||||||||
| NIATMI | -8.2 | -17.6 | 53.4% | -96.8 | |||||||||
| NIATMI continuing | -7.3 | -17.3 | 57.8% | -94.1 | |||||||||
| NIATMI discontinued | -0.9 | -0.3 | -200.0% | -2.7 | |||||||||
| Group Statement of Financial Position | |||||||||||||
| (in € million) | 1Q21 | FY20 | |||||||||||
| Tangible Assets | 138.9 | 134.3 | |||||||||||
| Intangible Assets | 200.7 | 202.0 | |||||||||||
| Other Non-Current Assets | 19.4 | 19.2 | |||||||||||
| Inventories | 24.2 | 25.7 | |||||||||||
| Trade and Other Short-term Receivables | 138.3 | 151.5 | |||||||||||
| Cash and Cash Equivalents | 90.6 | 100.0 | |||||||||||
| Assets Held for Sale | – | 16.2 | |||||||||||
| Total Assets | 612.1 | 648.9 | |||||||||||
| Share Capital | 47.1 | 47.1 | |||||||||||
| Other Equity Elements | -270.6 | -269.3 | |||||||||||
| Reserves from profit / (loss) recognized directly in other | – | -0.6 | |||||||||||
| comprehensive income and are related to assets held for sale | |||||||||||||
| Non-Controlling Interests | 1.5 | 3.7 | |||||||||||
| Total Shareholders’ Equity | -222.0 | -219.1 | |||||||||||
| Long-term Debt | 480.5 | 476.2 | |||||||||||
| Provisions/ Other Long-term Liabilities | 20.8 | 21.5 | |||||||||||
| Short-term Debt | 253.8 | 274.9 | |||||||||||
| Other Short-term Liabilities | 79.0 | 95.4 | |||||||||||
| Total Liabilities | 834.1 | 868.0 | |||||||||||
| Total Equity and Liabilities | 612.1 | 648.9 | |||||||||||
13
Group Statement of Cash Flows
| (in € million) | 1Q21 | 1Q20 | |
| EBT from continuing operations | -3.4 | -14.9 | |
| EBT from discontinued operations | 0.5 | – | |
| Plus/less Adjustments | 23.3 | 31.1 | |
| Decrease/(increase) of Inventories | -1.3 | 1.0 | |
| Decrease/(increase) of Receivable Accounts | 13.5 | -0.2 | |
| (Decrease)/increase of Payable Accounts | -17.6 | -2.0 | |
| Income Tax Paid | 6.6 | -5.5 | |
| Net Cash from Operating Activities | 21.6 | 9.5 | |
| Net CAPEX | -2.9 | -5.6 | |
| (Purchases) / Sales of subsidiaries & other investments | 13.3 | -0.5 | |
| Restricted bank deposits | -3.2 | -0.7 | |
| Interest received | 0.3 | 0.6 | |
| Dividends received | – | 1.0 | |
| Net Cash from Investing Activities | 7.5 | -5.2 | |
| Cash inflows from loans | – | 27.5 | |
| Repayment of loans | -11.2 | -27.2 | |
| Repayment of Leasing Obligations | -1.4 | -1.8 | |
| Interest and similar charges paid | -21.4 | -22.1 | |
| Dividends paid | -5.1 | -7.9 | |
| Net Cash from Financing Activities | -39.1 | -31.5 | |
| Net increase / (decrease) in cash for the period | -10.0 | -27.2 | |
| Exchange differences | 0.6 | -1.9 | |
| Cash at the beginning of the period | 100.0 | 171.1 | |
| Cash at the end of the period from total operations | 90.6 | 142.0 | |
-

 Africa5 days ago
QTech Games wins Best Innovation of the Year at the 2025 SBWA+ Eventus Awards
-

 Asia5 days ago
NODWIN Gaming and JioStar Unveil OnePlus Android BGMS Season 4
-
 Latest News5 days ago
Vindral appoints Henrik Fagerlund as Chairman of the Board
-

 Latest News5 days ago
Calema to Perform at Legends Charity Game in Lisbon
-
 Conferences in Europe5 days ago
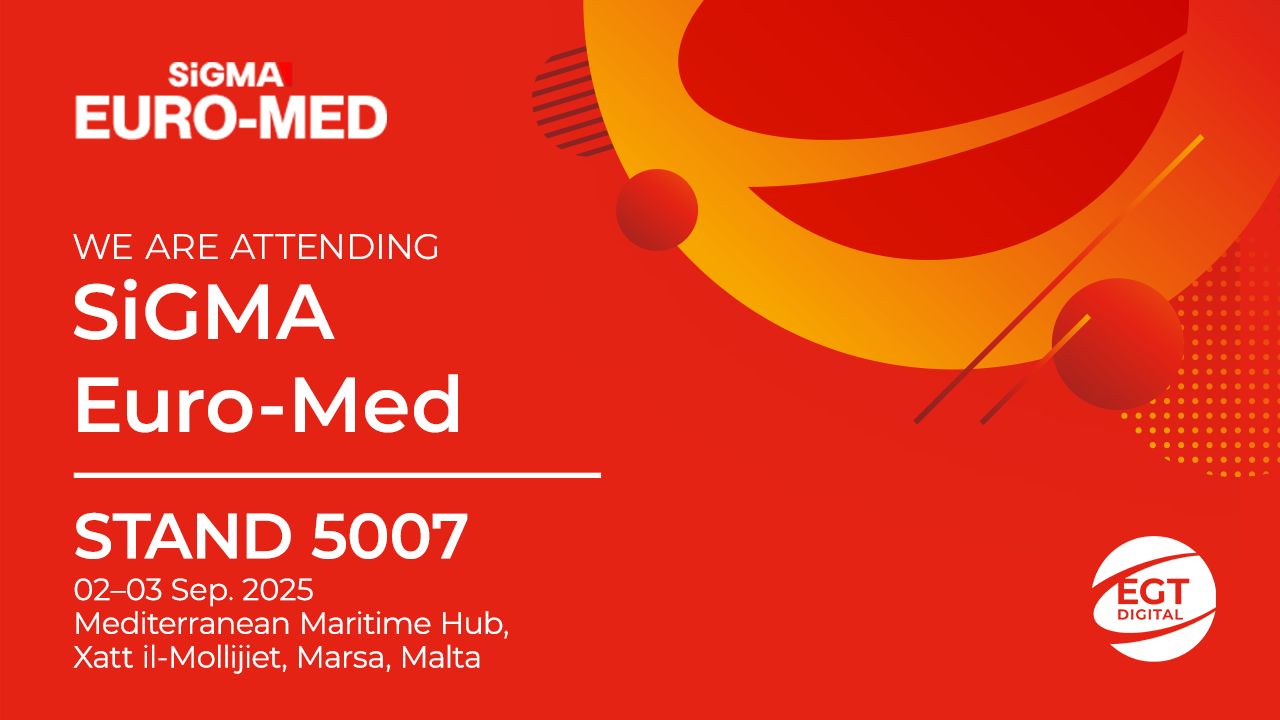
EGT Digital and EGT to rock the show at SiGMA Euro-Med 2025
-

 Latest News5 days ago
Push Gaming redefines its portfolio, unveiling new game categories and sub-brand for extended player reach
-

 Affiliate Industry5 days ago
Nikita Lukanenoks Brings Slotsjudge Into Spotlight With Affiliate Leaders Awards 2025 Nomination
-

 Latest News5 days ago
Thunderkick returns for an even fierier fiesta in Carnival Queen 2
