Industry News
Newgioco Reports Full Year 2018 Results

GGR Up 61%; 89% Increase in Handle;
Newgioco Group, Inc., a sports betting and gaming technology company providing regulated online and land-based gaming and wagering through licensed subsidiaries in Italy and Austria, and headquartered in Toronto, Canada, reported its financial and operating results for the 12 months ended December 31, 2018.
Full Year 2018 Financial and Business Highlights
- Revenue of $34.6 million, up 51.2%
- Gross gaming revenue (GGR) of $37.7 million, up 60.8%
- Handle of $413.2 million, up 89.1%
- Income from operations of $427,274, down 83.5% due to $3.1 million in non-recurring expenses including $1.0 million in investments for future growth, $1.6 million relating to legacy activities and items outside the normal course of business and $500,000 for executive compensation forgone in prior years
- Net loss of $3.05 million compared to net income of $1.4 million in 2017
- Adjusted EBITDA of $3.6 million compared to $2.6 million in 2017
- Accelerated roll out in rapidly developing U.S. sports betting market
- Significant progress made in strengthening management team and board of directors
- Conference call scheduled for 4:30 p.m. ET on March 7, 2019
“Newgioco generated more than $413 million in total handle in 2018, an 89.1% improvement over 2017 volume, demonstrating our continued, strong growth,” commented Michele (Mike) Ciavarella, Newgioco Chief Executive Officer. “Our web-based handle grew 120.9% to $235.9 million, becoming our largest revenue stream. In addition, regulated products like online poker and online casino, continue to grow rapidly, reducing the impact of volatility from our sports betting revenue. As this trend continues, the quarter-to-quarter impact of sports betting on our profitability should decrease, giving us greater visibility and predictability into our quarterly revenues.”
“On the sportsbook side, the fourth quarter, while favorable for bettors, was a challenging one for the industry operators, and December especially so, resulting in abnormally low conversion ratios,” added Mr. Ciavarella. “However, our industry leading risk management capabilities enabled Newgioco to maintain hold ratios which far exceeded industry averages. Looking into 2019, we are expecting our handle exclusively from Italian operations to exceed $500 million. Growth from other geographies, regulated web-based revenue streams and software service fees in the U.S. and other markets are expected to be incremental to this baseline, helping accelerate our overall growth rates as we harvest the investments of the last year.”
“In the second-half of 2018, and especially in the fourth quarter, we increased our investments in anticipation of accelerating near-term growth,” concluded Mr. Ciavarella. “This included investments in our U.S. operation, a more expansive trade show presence and schedule, our expanded sales office in Naples, Italy, and our expanded risk management facility in Teramo, Italy, as well as the addition of six new vice presidents that recently joined Newgioco along with our new Chief Financial Officer. We expect these growth-related investments, which totaled more than $2 million in expenses in 2018, to drive accelerating growth in 2019 and beyond. In addition, we incurred $2.1 million in non-recurring charges, including $1.1 million in non-cash expenses, related to our convertible debentures, $508,000 in non-recurring charges and $500,000 for executive compensation forgone in prior years, which impacted our 2018 profitability.”
“With most of the investments behind us and our ELYS platform now fully developed, we believe we are poised for accelerated growth in 2019,” added Mr. Ciavarella. “We expect to add two to three U.S. tribal and/or non-tribal casinos as SaaS customers by the end of 2019, with a target of approximately 50,000 active U.S. domiciled players. With continued, steady growth in Italy, opportunities to expand in Europe, Africa, Asia and South America, and this greenfield opportunity in the U.S., we believe continued revenue growth is achievable and will lead to improved operating margins.”
Full Year 2018 Financial Summary
Revenue
For the full year 2018, revenue was $34.6 million, an increase of $11.7 million or 51.2%, compared to revenue of $22.9 million 2017. The revenue increase was mainly attributable to a significant increase in handle partially offset by a shift in gaming mix.
General and Administrative Expenses
General and administrative expenses for the year ended December 31, 2018 were $10.0 million compared to $5.6 million for the year ended December 31, 2017, an increase of 78.7%. The increase was primarily due to significant investments in growth of $1 million in technology development, marketing, legal and other professional fees in support of the company’s expansion to the U.S., $1 million related to legacy activities, $609,000 related to items outside the normal course of business and $500,000 for executive compensation that was forgone in prior years.
Direct Selling Costs
Direct selling costs represent the fees paid to the company’s network service provider, license fees and commissions for field agents and promoters and are based on percentage of handle (turnover). For the year ended December 31, 2018 direct selling costs were $24.1 million compared to $14.7 million for the year ended December 31, 2017, an increase of 64.5%. The increase was primarily due to the significant increase in handle.
Interest Expense
Net interest expense was $2.6 million for the year ended December 31, 2018, including $2.0 million of Non-cash interest associated with debentures issued in 2018. The increase from $482,000 in 2017 was the result of interest expense incurred on debentures issued in 2018.
Net Income (Loss)
As a result of all of the above, for the year ended December 31, 2018, net loss was $3.0 million, or ($0.04) per diluted share based on a weighted average of 75,887,946 shares outstanding. In comparison, for the year ended December 31, 2017 the company reported net income of $1.4 million, or $0.02 per diluted share based on a fully-diluted weighted average shares outstanding of 75,344,948. Net loss for the period included $1.1 million in costs related to the repayment of convertible notes, and $1 million in investments related to the U.S. launch and product readiness efforts. In addition, the 2018 net loss included $300,000 in reimbursement for the CEO’s relocation to the United States to support the U.S. launch, $308,000 in costs directly related to product readiness and the expansion of offices to support future growth, and $500,000 in compensation catch-up related to executive salary forgone in prior years.
Other Comprehensive Income / (Loss)
For the year ended December 31, 2018 the Company recorded an expense of approximately $831,000 for foreign currency translation adjustment, compared to income of approximately $166,000 for foreign currency translation adjustment for the year ended December 31, 2017.
Adjusted EBITDA
Excluding the $3.1 million in charges described above, adjusted EBITDA for the year ended December 31, 2018 was $3.6 million compared to $2.6 million for the full year 2017. A reconciliation from Comprehensive Income (Loss), as shown in the company’s Consolidated Statements of Operations and Comprehensive Income (Loss), to Adjusted EBITDA is included in the tables of this press release.
Balance Sheet Summary
The Company had $6.3 million in unrestricted cash and cash equivalents as of December 31, 2018 compared to $6.5 million as of December 31, 2017. The Company also increased its Restricted Cash by approximately $1 million from $588,000 to $1.6 million.
Total debt outstanding was $5.4 million as of December 31, 2018 compared to $2.2 million as of December 31, 2017.
Non-GAAP Financial Measure – Adjusted EBITDA
This news release includes information on Adjusted EBITDA, which is a non-GAAP financial measure as defined by SEC Regulation G.
Management believes that Adjusted EBITDA, when viewed with our results under GAAP and the accompanying reconciliations, provides useful information about our period-over-period growth. Adjusted EBITDA is presented because management believes it provides additional information with respect to the performance of our fundamental business activities and is also frequently used by securities analysts, investors and other interested parties in the evaluation of comparable companies. We also rely on Adjusted EBITDA as a primary measure to review and assess the operating performance of our Company and our management team.
Adjusted EBITDA is a non-GAAP financial measure. We calculate adjusted EBITDA by taking comprehensive income (loss) and adding back the expenses related to foreign currency translation adjustment, total other expenses(loss), income taxes, product readiness and U.S market launch and adjustment for salary figures in prior years. Investors are cautioned that there are material limitations associated with the use of non-GAAP financial measures as an analytical tool. In addition, these measures may be different from non-GAAP financial measures used by other companies, limiting their usefulness for comparison purposes. We compensate for these limitations by providing specific information regarding the GAAP amounts excluded from these non-GAAP financial measures. Adjusted EBITDA should not be construed as a substitute for comprehensive income (loss) (as determined in accordance with GAAP) for the purpose of analyzing our operating performance or financial position, as Adjusted EBITDA is not defined by GAAP. A reconciliation of Adjusted EBITDA to comprehensive income (loss) is provided in the tables at the end of this press release.
Conference Call Information
The Company will host a conference call with investors and interested parties to review the results today at 4:30 p.m. ET. To access the conference call dial:
|
• United States: |
1-877-407-0792 |
|
• Toll-free: |
1-201-689-8263 |
|
Reference confirmation code: 13688357 |
|
A replay will be available until March 21, 2019 which can be accessed by dialing 1-844-512-2921 if calling within the United States or 1-412-317-6671 if calling internationally. Please use passcode 13688357 to access the replay.
The call will also be accompanied live by webcast over the Internet and accessible at https://public.viavid.com/index.php?id=133543.
About Newgioco Group, Inc.
Newgioco Group, Inc., headquartered in Toronto, Canada, is a vertically-integrated leisure gaming technology company, with fully licensed online and land-based gaming operations and innovative betting technology platforms that provide bet processing for casinos and other gaming operators. The Company conducts its business under the registered brand Newgioco primarily through its internet-based betting distribution network on its website, www.newgioco.it as well as retail neighborhood betting shops situated throughout Italy.
The Company offers its clients a full suite of leisure gaming products and services, such as sports betting, virtual sports, online casino, poker, bingo, interactive games and slots. Newgioco also owns and operates innovative betting platform software providing both B2B and B2C bet processing for casinos, sports betting and other online and land-based gaming operators. Additional information including information about EBITDA presentation is available on our corporate website at www.newgiocogroup.com and will remain on our website indefinitely as we will continue to present values for EBITDA.
Forward-Looking Statements
This press release contains certain forward-looking statements within the meaning of the safe harbor provisions of the Private Securities Litigation Reform Act of 1995. These statements are identified by the use of the words “could,” “believe,” “anticipate,” “intend,” “estimate,” “expect,” “may,” “continue,” “predict,” “potential,” “project” and similar expressions that are intended to identify forward-looking statements and includes statements such as the quarter-to-quarter impact of sports betting on our profitability decreasing, our handle exclusively from Italian operations exceeding $500 million with industry leading conversion ratios, growth-related investments driving accelerating growth in 2019 and beyond, being poised for accelerated growth in 2019, adding two to three U.S. tribal and/or non-tribal casinos as SaaS customers by the end of 2019, and achieving revenue growth of 25% to 35%, with operating margins in the 10 to 15% range . These forward-looking statements are based on management’s expectations and assumptions as of the date of this press release and are subject to a number of risks and uncertainties, many of which are difficult to predict that could cause actual results to differ materially from current expectations and assumptions from those set forth or implied by any forward-looking statements. Important factors that could cause actual results to differ materially from current expectations include our ability to decrease the quarter-to-quarter impact of sports betting on our profitability, our ability to generate a handle exclusively from Italian operations exceeding $500 million with industry leading conversion ratios, our ability to implement growth-related investments to drive accelerating growth in 2019 and beyond, our ability to achieve accelerated growth in 2019, our ability to add two to three U.S. tribal and/or non-tribal casinos as SaaS customers by the end of 2019, our ability to achieve revenue growth of 25% to 35%, with operating margins in the 10 to 15% range, and the risk factors described in Newgioco’s Annual Report on Form 10-K and subsequent filings with the U.S. Securities and Exchange Commission, including subsequent periodic reports on Forms 10-Q and 8-K. The information in this release is provided only as of the date of this release, and we undertake no obligation to update or revise publicly any forward-looking statements, whether as a result of new information, future events or otherwise, after the date on which the statements are made or to reflect the occurrence of unanticipated events, except as required by law.
— Tables Follow –
|
NEWGIOCO GROUP, INC. |
||||||||
|
December 31, 2018 |
December 31, 2017 |
|||||||
|
Current Assets |
||||||||
|
Cash and cash equivalents |
$ |
6,289,903 |
$ |
6,469,858 |
||||
|
Accounts receivable |
10,082 |
116,489 |
||||||
|
Gaming accounts receivable |
1,021,052 |
1,163,831 |
||||||
|
Prepaid expenses |
124,712 |
87,692 |
||||||
|
Related party receivable |
49,914 |
— |
||||||
|
Other current assets |
55,700 |
12,543 |
||||||
|
Total Current Assets |
7,551,363 |
7,850,413 |
||||||
|
Noncurrent Assets |
||||||||
|
Restricted cash |
1,560,539 |
587,905 |
||||||
|
Property, plant and equipment |
354,799 |
280,111 |
||||||
|
Intangible assets |
12,583,457 |
3,245,748 |
||||||
|
Goodwill |
262,552 |
260,318 |
||||||
|
Investment in non-consolidated entities |
275,000 |
1 |
||||||
|
Total Noncurrent Assets |
15,036,347 |
4,374,083 |
||||||
|
Total Assets |
$ |
22,587,710 |
$ |
12,224,496 |
||||
|
Current Liabilities |
||||||||
|
Line of credit – bank |
$ |
750,000 |
$ |
177,060 |
||||
|
Accounts payable and accrued liabilities |
4,603,608 |
1,606,560 |
||||||
|
Gaming accounts balances |
1,049,423 |
1,274,856 |
||||||
|
Taxes payable |
1,056,430 |
1,555,371 |
||||||
|
Advances from stockholders |
39,237 |
547,809 |
||||||
|
Liability in connection with acquisition |
— |
142,245 |
||||||
|
Debentures, net of discount |
3,942,523 |
1,148,107 |
||||||
|
Derivative liability |
— |
222,915 |
||||||
|
Promissory notes payable – other |
— |
100,749 |
||||||
|
Promissory notes payable – related party |
318,078 |
318,078 |
||||||
|
Bank loan payable – current portion |
120,920 |
121,208 |
||||||
|
Total Current Liabilities |
11,880,219 |
7,214,958 |
||||||
|
Bank loan payable |
225,131 |
362,808 |
||||||
|
Other long-term liabilities |
608,728 |
532,680 |
||||||
|
Total Liabilities |
12,714,078 |
8,110,446 |
||||||
|
Stockholders’ Equity |
||||||||
|
Preferred stock, $0.0001 par value; 20,000,000 shares authorized, none issued |
— |
— |
||||||
|
Common Stock, $0.0001 par value, 160,000,000 shares authorized; 75,540,298 |
7,555 |
7,415 |
||||||
|
Additional paid-in capital |
23,956,309 |
14,254,582 |
||||||
|
Accumulated other comprehensive income |
(1,081,338) |
(250,327) |
||||||
|
Accumulated deficit |
(13,008,894) |
(9,897,620) |
||||||
|
Total Stockholders’ Equity |
9,873,632 |
4,114,050 |
||||||
|
Total Liabilities and Stockholders’ Equity |
$ |
22,587,710 |
$ |
12,224,496 |
||||
|
NEWGIOCO GROUP, INC. |
||||||||
|
For the year ended December 31, |
||||||||
|
2018 |
2017 |
|||||||
|
Revenue |
$ |
34,575,097 |
$ |
22,865,146 |
||||
|
Costs and Expenses |
||||||||
|
Selling expenses |
24,142,110 |
14,672,099 |
||||||
|
General and administrative expenses |
10,005,713 |
5,597,881 |
||||||
|
Total Costs and Expenses |
34,147,823 |
20,269,980 |
||||||
|
Income (Loss) from Operations |
427,274 |
2,595,166 |
||||||
|
Other Expenses (Income) |
||||||||
|
Interest expense, net of interest income |
2,614,837 |
482,367 |
||||||
|
Changes in fair value of derivative liabilities |
— |
(257,231) |
||||||
|
Imputed interest on related party advances |
761 |
24,365 |
||||||
|
Gain on litigation settlement |
(516,120) |
— |
||||||
|
Loss on issuance of debt |
196,403 |
— |
||||||
|
Impairment on investment |
— |
6,855 |
||||||
|
Other Expense |
75,000 |
— |
||||||
|
Total Other Expenses (Income) |
2,370,881 |
256,356 |
||||||
|
Income (Loss) Before Income Taxes |
(1,943,607) |
2,338,810 |
||||||
|
Income tax provision |
1,102,701 |
972,924 |
||||||
|
Net Income (Loss) |
$ |
(3,046,308) |
$ |
1,365,886 |
||||
|
Other Comprehensive Income (Loss) |
||||||||
|
Foreign currency translation adjustment |
(831,011) |
166,304 |
||||||
|
Comprehensive Income (Loss) |
$ |
(3,877,319) |
$ |
1,532,190 |
||||
|
Income (loss) per common share – basic |
(0.04) |
0.02 |
||||||
|
Income (loss) per common share – diluted |
(0.04) |
0.02 |
||||||
|
Weighted average number of common shares outstanding – basic |
75,887,946 |
74,032,631 |
||||||
|
Weighted average number of common shares outstanding – diluted |
75,887,946 |
75,344,948 |
||||||
|
NEWGIOCO GROUP, INC. |
||||||||
|
For the years ended December 31, |
||||||||
|
Cash Flows from Operating Activities |
2018 |
2017 |
||||||
|
Net income (loss) |
$ |
(3,046,308) |
$ |
1,365,886 |
||||
|
Adjustments to reconcile net income (loss) to net cash provided by |
||||||||
|
Depreciation and amortization |
488,464 |
601,266 |
||||||
|
Amortization of deferred costs |
58,188 |
100,329 |
||||||
|
Non-cash interest |
1,995,128 |
205,216 |
||||||
|
Loss on issuance of debt |
196,403 |
— |
||||||
|
Imputed interest on advances from stockholders |
1,514 |
24,365 |
||||||
|
Changes in fair value of derivative liabilities |
— |
(257,231) |
||||||
|
Unrealized loss on trading securities |
75,000 |
— |
||||||
|
Impairment (recovery) of assets |
(518,354) |
6,855 |
||||||
|
Stock issued for services |
— |
23,250 |
||||||
|
Bad debt expense |
6,354 |
135,953 |
||||||
|
Changes in Operating Assets and Liabilities |
||||||||
|
Prepaid expenses |
(95,209) |
(85,301) |
||||||
|
Accounts payable and accrued liabilities |
3,062,422 |
482,904 |
||||||
|
Accounts receivable |
100,053 |
(91,603) |
||||||
|
Gaming accounts receivable |
142,779 |
(654,287) |
||||||
|
Gaming accounts liabilities |
(225,433) |
435,771 |
||||||
|
Taxes payable |
(498,941) |
903,187 |
||||||
|
Other current assets |
(43,157) |
(2,304) |
||||||
|
Customer deposits |
— |
138,359 |
||||||
|
Long term liability |
76,048 |
26,059 |
||||||
|
Net Cash Provided by (Used in) Operating Activities |
1,774,952 |
3,358,674 |
||||||
|
Cash Flows from Investing Activities |
||||||||
|
Acquisition of property, plant, and equipment, and intangible assets |
(4,455,099) |
(180,722) |
||||||
|
Increase in restricted cash |
(972,634) |
(45,142) |
||||||
|
Net Cash Used in Investing Activities |
(5,427,733) |
(225,864) |
||||||
|
Cash Flows from Financing Activities |
||||||||
|
Proceeds from (repayment of) bank credit line, net |
750,000 |
165,925 |
||||||
|
Proceeds from (repayment of) bank loan |
(137,965) |
(109,104) |
||||||
|
Repayment of bank credit line |
(177,060) |
— |
||||||
|
Proceeds from debentures and convertible notes, net of repayment |
6,883,906 |
591,202 |
||||||
|
Advance to related party |
(49,914) |
|||||||
|
Purchase of treasury stock |
(2,261,307) |
— |
||||||
|
Advances from stockholders, net of repayment |
(508,572) |
(77,398) |
||||||
|
Net Cash Provided by (Used in) Financing Activities |
4,499,088 |
570,625 |
||||||
|
Effect of change in exchange rate |
(1,026,262) |
536,001 |
||||||
|
Net increase (decrease) in cash |
(179,955) |
4,239,436 |
||||||
|
Cash – beginning of the period |
6,469,858 |
2,230,422 |
||||||
|
Cash – end of the period |
$ |
6,289,903 |
$ |
6,469,858 |
||||
|
NEWGIOCO GROUP, INC. |
||||||||
|
(in thousands) |
For the year ended December 31, |
|||||||
|
2018 |
2017 |
|||||||
|
Comprehensive Income (Loss) |
$ |
(3,877,319) |
$ |
1,532,190 |
||||
|
Total Other Expenses (Income) |
2,370,881 |
256,356 |
||||||
|
Foreign currency translation adjustment |
831,011 |
(166,304) |
||||||
|
Income tax provision |
1,102,701 |
972,924 |
||||||
|
EBITDA |
427,274 |
2,595,166 |
||||||
|
Product Readiness and U.S. Market Launch |
1,019,500 |
— |
||||||
|
Items Relating to Legacy Activities |
1,000,000 |
— |
||||||
|
Items Outside the Normal Course of Business |
608,600 |
— |
||||||
|
Adjustment for salary forgone in prior years |
500,000 |
— |
||||||
|
Adjusted EBITDA |
$ |
3,555,374 |
$ |
2,595,166 |
||||
SOURCE Newgioco Group, Inc.
-
 Asia7 days ago
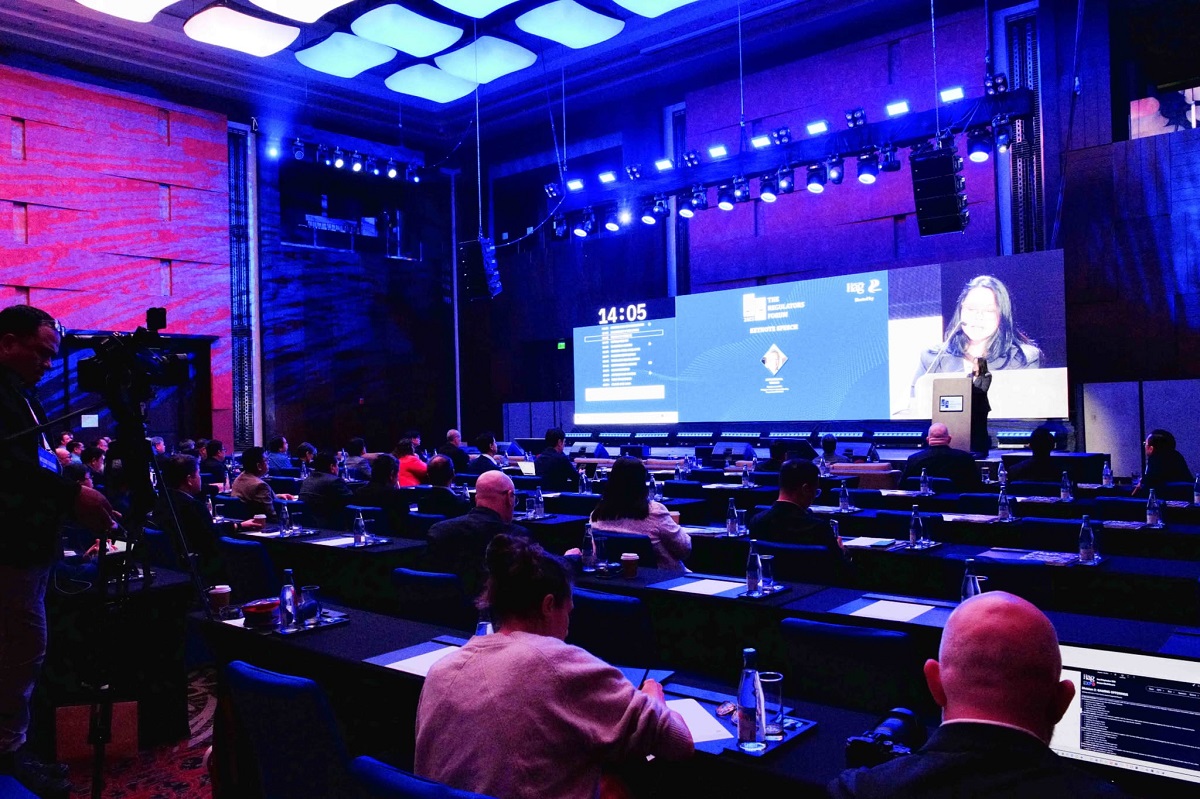
Digital gaming disruption tackled in 1st AsPac Regulators’ Forum
-

 Africa7 days ago
BetKing Renews Ikorodu City FC Partnership for 2025/26 NPFL Season
-

 Compliance Updates7 days ago
Kongebonus statement: Norway’s election result signals gambling policy continuity, but licensing debate is set to intensify
-

 Balkans7 days ago
BEGE Awards Nominations Now Open – Celebrating 16 Years of Industry Excellence!
-

 Latest News7 days ago
Win a Fruity Fortune in BGaming’s Bonanza Trillion
-

 Latest News7 days ago
Answer the Call of the Wild: ELA Games Unveils Its Latest Game “Buffalo Force”
-

 Latest News7 days ago
Slots Temple Announces Exclusive Free-to-Play Tournament Partnership with Pragmatic Play
-

 Latest News7 days ago
Saddle up for big wins under the Bison Moon with the latest slot from Northern Lights Gaming
