

Gambling in the USA
Century Casinos, Inc. Announces Second Quarter 2018 Results
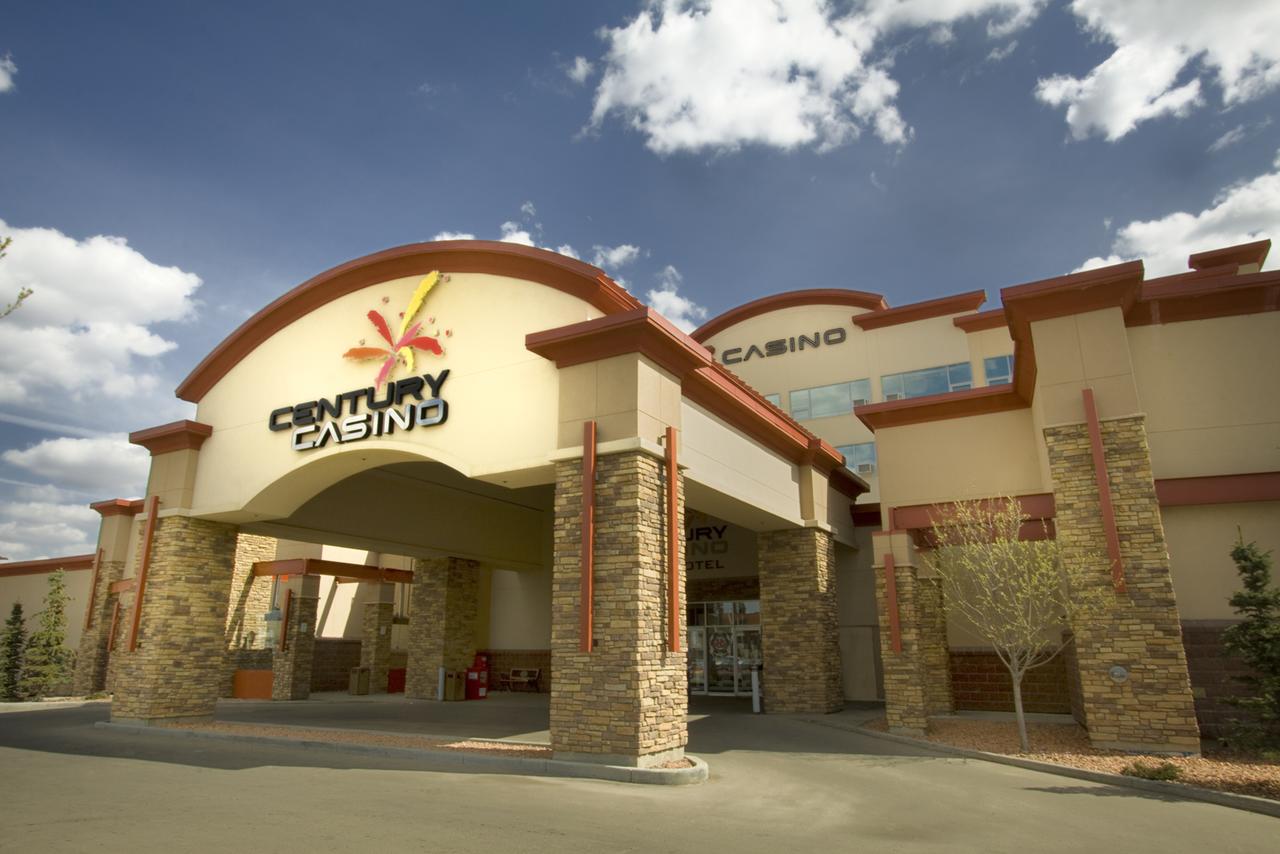
COLORADO SPRINGS, Colo., Aug. 8, 2018 – Century Casinos, Inc. (Nasdaq Capital Market®: CNTY) today announced its financial results for the three and six months ended June 30, 2018.
Second Quarter 2018 Highlights*
- Net operating revenue was $39.6 million, an increase of 6% from the three months ended June 30, 2017.
- Earnings from operations were $1.0 million, a decrease of 73% from the three months ended June 30, 2017.
- Net earnings attributable to Century Casinos, Inc. shareholders was $0.3 million, a decrease of 82% from the three months ended June 30, 2017.
- Adjusted EBITDA** was $4.7 million, a decrease of 27% from the three months ended June 30, 2017.
- Earnings per share were $0.01.
- Book value per share*** at June 30, 2018 was $6.02.
The consolidated results for the three and six months ended June 30, 2018 and 2017 are as follows:
|
For the three months |
For the six months |
|||||||||||||||
|
Amounts in thousands, except per share data |
ended June 30, |
ended June 30, |
||||||||||||||
|
Consolidated Results: |
2018 |
2017 |
% Change |
2018 |
2017 |
% Change |
||||||||||
|
Net Operating Revenue |
$ |
39,648 |
$ |
37,330 |
6% |
$ |
80,270 |
$ |
73,729 |
9% |
||||||
|
Earnings from Operations |
996 |
3,641 |
(73%) |
4,249 |
8,133 |
(48%) |
||||||||||
|
Net Earnings Attributable to Century Casinos, Inc. |
$ |
317 |
$ |
1,802 |
(82%) |
$ |
1,244 |
$ |
3,962 |
(69%) |
||||||
|
Adjusted EBITDA** |
$ |
4,661 |
$ |
6,412 |
(27%) |
$ |
11,226 |
$ |
13,131 |
(15%) |
||||||
|
Earnings Per Share: |
||||||||||||||||
|
Basic and Diluted |
$ |
0.01 |
$ |
0.07 |
(86%) |
$ |
0.04 |
$ |
0.16 |
(75%) |
||||||
“This quarter represented an important period for the long-term success of the Company. We opened our casino in Bath, England in May; we laid the foundation of a land-based presence in Asia with our Vietnam project; and we are finally seeing stability in Poland where we now hold eight casino licenses,” Erwin Haitzmann and Peter Hoetzinger, Co-Chief Executive Officers of Century Casinos remarked. “We are pleased with the growth of net operating revenue driven by strong performances in Canada, which increased 5% in local currency, and Colorado, which increased 7%,” they continued. “Adjusted EBITDA was lower compared to prior year results due to additional non-recurring expenses related to the licensing situation in Poland and the opening of the casino in Bath,” Haitzmann and Hoetzinger concluded.
Reportable Segment Results*
The table below shows the Company’s operating segments that are included in each of the Company’s reportable segments as of June 30, 2018:
|
Reportable Segment |
Operating Segment |
|
Canada |
Century Casino & Hotel – Edmonton |
|
Canada |
Century Casino St. Albert |
|
Canada |
Century Casino Calgary |
|
Canada |
Century Downs Racetrack and Casino |
|
Canada |
Century Bets! |
|
Canada |
Century Mile Racetrack and Casino |
|
United States |
Century Casino & Hotel – Central City |
|
United States |
Century Casino & Hotel – Cripple Creek |
|
Poland |
Casinos Poland |
|
Corporate and Other |
Cruise Ships & Other |
|
Corporate and Other |
Century Casino Bath |
|
Corporate and Other |
Corporate Other |
The Company’s net operating revenue increased by $2.3 million, or 6%, and by $6.5 million, or 9%, for the three and six months ended June 30, 2018, compared to the three and six months ended June 30, 2017. Following is a summary of the changes in net operating revenue by reportable segment for the three and six months ended June 30, 2018, compared to the three and six months ended June 30, 2017:
|
Net Operating Revenue |
||||||||||||||||||||||
|
For the three months |
For the six months |
|||||||||||||||||||||
|
ended june 30, |
ended June 30, |
|||||||||||||||||||||
|
Amounts in |
2018 |
2017 |
$ Change |
% Change |
2018 |
2017 |
$ Change |
% Change |
||||||||||||||
|
Canada |
$ |
15,331 |
$ |
14,040 |
$ |
1,291 |
9% |
$ |
30,004 |
$ |
27,202 |
$ |
2,802 |
10% |
||||||||
|
United States |
8,476 |
7,943 |
533 |
7% |
16,183 |
15,443 |
740 |
5% |
||||||||||||||
|
Poland |
14,567 |
14,287 |
280 |
2% |
31,949 |
28,833 |
3,116 |
11% |
||||||||||||||
|
Corporate and |
1,274 |
1,060 |
214 |
20% |
2,134 |
2,251 |
(117) |
(5%) |
||||||||||||||
|
Consolidated |
$ |
39,648 |
$ |
37,330 |
$ |
2,318 |
6% |
$ |
80,270 |
$ |
73,729 |
$ |
6,541 |
9% |
||||||||
The Company’s earnings from operations decreased by ($2.6) million, or (73%), and by ($3.9) million, or (48%), for the three and six months ended June 30, 2018, compared to the three and six months ended June 30, 2017. Following is a summary of the changes in earnings (loss) from operations by reportable segment for the three and six months ended June 30, 2018, compared to the three and six months ended June 30, 2017:
|
Earnings (Loss) from Operations |
||||||||||||||||||||||
|
For the three months |
For the six months |
|||||||||||||||||||||
|
ended June 30, |
ended June 30, |
|||||||||||||||||||||
|
Amounts in |
2018 |
2017 |
$ Change |
% Change |
2018 |
2017 |
$ Change |
% Change |
||||||||||||||
|
Canada |
$ |
3,785 |
$ |
3,647 |
$ |
138 |
4% |
$ |
7,340 |
$ |
6,694 |
$ |
646 |
10% |
||||||||
|
United States |
1,548 |
1,346 |
202 |
15% |
2,724 |
2,504 |
220 |
9% |
||||||||||||||
|
Poland |
(1,351) |
636 |
(1,987) |
(312%) |
(329) |
2,442 |
(2,771) |
(114%) |
||||||||||||||
|
Corporate and |
(2,986) |
(1,988) |
(998) |
(50%) |
(5,486) |
(3,507) |
(1,979) |
(56%) |
||||||||||||||
|
Consolidated |
$ |
996 |
$ |
3,641 |
$ |
(2,645) |
(73%) |
$ |
4,249 |
$ |
8,133 |
$ |
(3,884) |
(48%) |
||||||||
Net earnings attributable to Century Casinos, Inc. shareholders decreased by ($1.5) million, or (82%), and by ($2.7) million, or (69%), for the three and six months ended June 30, 2018, compared to the three and six months ended June 30, 2017. Following is a summary of the changes in net earnings (loss) attributable to Century Casinos, Inc. shareholders by reportable segment for the three and six months ended June 30, 2018, compared to the three and six months ended June 30, 2017:
|
Net Earnings (Loss) Attributable to Century Casinos, Inc. Shareholders |
||||||||||||||||||||||
|
For the three months |
For the six months |
|||||||||||||||||||||
|
ended June 30, |
ended June 30, |
|||||||||||||||||||||
|
Amounts in |
2018 |
2017 |
$ Change |
% Change |
2018 |
2017 |
$ Change |
% Change |
||||||||||||||
|
Canada |
$ |
1,947 |
$ |
1,823 |
$ |
124 |
7% |
$ |
3,972 |
$ |
3,306 |
$ |
666 |
20% |
||||||||
|
United States |
1,151 |
836 |
315 |
38% |
2,025 |
1,553 |
472 |
30% |
||||||||||||||
|
Poland |
(776) |
435 |
(1,211) |
(278%) |
(246) |
1,518 |
(1,764) |
(116%) |
||||||||||||||
|
Corporate and |
(2,005) |
(1,292) |
(713) |
(55%) |
(4,507) |
(2,415) |
(2,092) |
(87%) |
||||||||||||||
|
Consolidated |
$ |
317 |
$ |
1,802 |
$ |
(1,485) |
(82%) |
$ |
1,244 |
$ |
3,962 |
$ |
(2,718) |
(69%) |
||||||||
Items deducted from or added to earnings from operations to arrive at net earnings (loss) attributable to Century Casinos, Inc. shareholders include interest income, interest expense, gains (losses) on foreign currency transactions and other, income tax expense and non-controlling interests.
The Company’s Adjusted EBITDA** decreased by ($1.8) million, or (27%), and by ($1.9) million, or (15%), for the three and six months ended June 30, 2018 compared to the three and six months ended June 30, 2017. Following is a summary of the changes in Adjusted EBITDA** by reportable segment for the three and six months ended June 30, 2018 compared to the three and six months ended June 30, 2017:
|
Adjusted EBITDA** |
||||||||||||||||||||||
|
For the three months |
For the six months |
|||||||||||||||||||||
|
ended June 30, |
ended June 30, |
|||||||||||||||||||||
|
Amounts in |
2018 |
2017 |
$ Change |
% Change |
2018 |
2017 |
$ Change |
% Change |
||||||||||||||
|
Canada |
$ |
4,992 |
$ |
4,502 |
$ |
490 |
11% |
$ |
9,702 |
$ |
8,381 |
$ |
1,321 |
16% |
||||||||
|
United States |
2,091 |
1,964 |
127 |
7% |
3,811 |
3,732 |
79 |
2% |
||||||||||||||
|
Poland |
153 |
1,574 |
(1,421) |
(90%) |
2,256 |
3,952 |
(1,696) |
(43%) |
||||||||||||||
|
Corporate and |
(2,575) |
(1,628) |
(947) |
(58%) |
(4,543) |
(2,934) |
(1,609) |
(55%) |
||||||||||||||
|
Consolidated |
$ |
4,661 |
$ |
6,412 |
$ |
(1,751) |
(27%) |
$ |
11,226 |
$ |
13,131 |
$ |
(1,905) |
(15%) |
||||||||
|
* Amounts presented are rounded. As such, rounding differences could occur in period over period changes and percentages reported. |
Balance Sheet and Liquidity
As of June 30, 2018, the Company had $54.4 million in cash and cash equivalents and $54.3 million in outstanding debt on its balance sheet compared to $74.7 million in cash and cash equivalents and $56.7 million in outstanding debt at December 31, 2017. The outstanding debt as of June 30, 2018included $34.0 million related to the Company’s BMO Credit Agreement, $2.8 million of bank debt related to Casinos Poland, $2.6 million of bank debt related to Century Casino Bath, $0.3 millionrelated to capital leases for Century Resorts Alberta, Century Casino Calgary, Century Casino St. Albert, Century Downs Racetrack and Casino (“CDR”) and Century Mile Racetrack and Casino, and $14.8 million related to a long-term land lease for CDR, net of $0.2 million in deferred financing costs.
Conference Call Information
Today the Company will post a copy of its quarterly report on Form 10-Q filed with the SEC for the quarter ended June 30, 2018 on its website at http://corporate.cnty.com/investor-relations/sec-filings. The Company will also post a presentation on the second quarter results on its website at http://corporate.cnty.com/investor-relations/presentations-and-interviews.
The Company will host its second quarter 2018 earnings conference call tomorrow, Thursday, August 9th, at 8:00 am MDT; 4:00 pm CEST, respectively. U.S. domestic participants should dial 1-844-244-9160. For all international participants, please use 330-931-4670 to dial-in. Participants may listen to the call live at https://centurycasinos.adobeconnect.com/earningsrelease or obtain a recording of the call on the Company’s website until August 31, 2018 at http://corporate.cnty.com/investor-relations/sec-filings.
|
CENTURY CASINOS, INC. AND SUBSIDIARIES |
||||||||||||
|
Condensed Consolidated Statements of Earnings |
||||||||||||
|
For the three months |
For the six months |
|||||||||||
|
ended June 30, |
ended June 30, |
|||||||||||
|
Amounts in thousands, except for per share information |
2018 |
2017 |
2018 |
2017 |
||||||||
|
Operating revenue: |
||||||||||||
|
Net operating revenue |
$ |
39,648 |
$ |
37,330 |
$ |
80,270 |
$ |
73,729 |
||||
|
Operating costs and expenses: |
||||||||||||
|
Total operating costs and expenses |
38,651 |
33,689 |
76,020 |
65,596 |
||||||||
|
Loss from equity investment |
(1) |
— |
(1) |
— |
||||||||
|
Earnings from operations |
996 |
3,641 |
4,249 |
8,133 |
||||||||
|
Non-operating income (expense), net |
(885) |
(607) |
(1,838) |
(1,304) |
||||||||
|
Earnings before income taxes |
111 |
3,034 |
2,411 |
6,829 |
||||||||
|
Income tax provision |
(14) |
(864) |
(993) |
(1,859) |
||||||||
|
Net earnings |
97 |
2,170 |
1,418 |
4,970 |
||||||||
|
Net loss (earnings) attributable to non-controlling interests |
220 |
(368) |
(174) |
(1,008) |
||||||||
|
Net earnings attributable to Century Casinos, Inc. |
$ |
317 |
$ |
1,802 |
$ |
1,244 |
$ |
3,962 |
||||
|
Earnings per share attributable to Century Casinos, |
||||||||||||
|
Basic |
$ |
0.01 |
$ |
0.07 |
$ |
0.04 |
$ |
0.16 |
||||
|
Diluted |
$ |
0.01 |
$ |
0.07 |
$ |
0.04 |
$ |
0.16 |
||||
|
Weighted average common shares |
||||||||||||
|
Basic |
29,376 |
24,466 |
29,369 |
24,460 |
||||||||
|
Diluted |
29,974 |
24,962 |
29,984 |
24,911 |
||||||||
|
CENTURY CASINOS, INC. AND SUBSIDIARIES |
||||||
|
Condensed Consolidated Balance Sheets |
||||||
|
(Amounts in thousands) |
||||||
|
June 30, |
December 31, |
|||||
|
2018 |
2017 |
|||||
|
Assets |
||||||
|
Current assets |
$ |
63,188 |
$ |
84,321 |
||
|
Property and equipment, net |
169,809 |
152,778 |
||||
|
Other assets |
36,410 |
37,777 |
||||
|
Total assets |
$ |
269,407 |
$ |
274,876 |
||
|
Liabilities and Equity |
||||||
|
Current liabilities |
$ |
37,198 |
$ |
34,438 |
||
|
Non-current liabilities |
47,960 |
53,120 |
||||
|
Century Casinos, Inc. shareholders’ equity |
176,884 |
179,897 |
||||
|
Non-controlling interests |
7,365 |
7,421 |
||||
|
Total liabilities and equity |
$ |
269,407 |
$ |
274,876 |
||
|
CENTURY CASINOS, INC. AND SUBSIDIARIES |
||||||||||||||||
|
Constant Currency* Results (unaudited) |
||||||||||||||||
|
For the three months |
For the six months |
|||||||||||||||
|
ended June 30, |
ended June 30, |
|||||||||||||||
|
Amounts in thousand |
2018 |
2017 |
% Change |
2018 |
2017 |
% Change |
||||||||||
|
Net operating revenue as reported (GAAP) |
$ |
39,648 |
$ |
37,330 |
6% |
$ |
80,270 |
$ |
73,729 |
9% |
||||||
|
Foreign currency impact vs. 2017 |
(1,608) |
(5,035) |
||||||||||||||
|
Net operating revenue constant currency |
$ |
38,040 |
$ |
37,330 |
2% |
$ |
75,235 |
$ |
73,729 |
2% |
||||||
|
Earnings from operations (GAAP) |
$ |
996 |
$ |
3,641 |
(73%) |
$ |
4,249 |
$ |
8,133 |
(48%) |
||||||
|
Foreign currency impact vs. 2017 |
(16) |
(230) |
||||||||||||||
|
Earnings from operations constant currency |
$ |
980 |
$ |
3,641 |
(73%) |
$ |
4,019 |
$ |
8,133 |
(51%) |
||||||
|
Net earnings attributable to Century Casinos, |
$ |
317 |
$ |
1,802 |
(82%) |
$ |
1,244 |
$ |
3,962 |
(69%) |
||||||
|
Foreign currency impact vs. 2017 |
(10) |
(61) |
||||||||||||||
|
Net earnings attributable to Century Casinos, |
$ |
307 |
$ |
1,802 |
(83%) |
$ |
1,183 |
$ |
3,962 |
(70%) |
||||||
Gains and losses on foreign currency transactions are added back to net earnings in the Company’s Adjusted EBITDA** calculations. As such, there is no foreign currency impact to Adjusted EBITDA** when calculating Constant Currency* results.
|
Adjusted EBITDA Margins *** (unaudited) |
||||
|
For the three months |
For the six months |
|||
|
ended June 30, |
ended June 30, |
|||
|
2018 |
2017 |
2018 |
2017 |
|
|
Canada |
33% |
32% |
32% |
31% |
|
United States |
25% |
25% |
24% |
24% |
|
Poland |
1% |
11% |
7% |
14% |
|
Corporate and Other |
(202%) |
(154%) |
(213%) |
(130%) |
|
Consolidated Adjusted EBITDA Margin |
12% |
17% |
14% |
18% |
|
CENTURY CASINOS, INC. AND SUBSIDIARIES |
|||||||||||||||
|
Reconciliation of Adjusted EBITDA ** to Net Earnings (Loss) Attributable to Century Casinos, Inc. Shareholders by Reportable |
|||||||||||||||
|
For the three months ended June 30, 2018 |
|||||||||||||||
|
Amounts in thousands |
Canada |
United States |
Poland |
Corporate and Other |
Total |
||||||||||
|
Net earnings (loss) |
$ |
1,947 |
$ |
1,151 |
$ |
(776) |
$ |
(2,005) |
$ |
317 |
|||||
|
Interest expense (income), net |
1,020 |
— |
36 |
19 |
1,075 |
||||||||||
|
Income taxes (benefit) |
684 |
397 |
(210) |
(857) |
14 |
||||||||||
|
Depreciation and amortization |
798 |
546 |
673 |
153 |
2,170 |
||||||||||
|
Net earnings (loss) attributable to non- |
199 |
— |
(389) |
(30) |
(220) |
||||||||||
|
Non-cash stock-based compensation |
— |
— |
— |
232 |
232 |
||||||||||
|
Gain on foreign currency transactions |
(65) |
— |
(12) |
(113) |
(190) |
||||||||||
|
Loss (Gain) on disposition of fixed assets |
1 |
(3) |
831 |
— |
829 |
||||||||||
|
Pre-opening expenses |
408 |
— |
— |
26 |
434 |
||||||||||
|
Adjusted EBITDA |
$ |
4,992 |
$ |
2,091 |
$ |
153 |
$ |
(2,575) |
$ |
4,661 |
|||||
|
For the three months ended June 30, 2017 |
|||||||||||||||
|
Amounts in thousands |
Canada |
United States |
Poland |
Corporate and Other |
Total |
||||||||||
|
Net earnings (loss) |
$ |
1,823 |
$ |
836 |
$ |
435 |
$ |
(1,292) |
$ |
1,802 |
|||||
|
Interest expense (income), net |
867 |
— |
29 |
(8) |
888 |
||||||||||
|
Income taxes (benefit) |
794 |
510 |
198 |
(638) |
864 |
||||||||||
|
Depreciation and amortization |
845 |
618 |
472 |
83 |
2,018 |
||||||||||
|
Net earnings attributable to non- |
150 |
— |
218 |
— |
368 |
||||||||||
|
Non-cash stock-based compensation |
— |
— |
— |
126 |
126 |
||||||||||
|
Loss (gain) on foreign currency |
13 |
— |
(244) |
(50) |
(281) |
||||||||||
|
Loss on disposition of fixed assets |
10 |
— |
241 |
— |
251 |
||||||||||
|
Acquisition costs |
— |
— |
— |
151 |
151 |
||||||||||
|
Pre-opening expenses |
— |
— |
225 |
— |
225 |
||||||||||
|
Adjusted EBITDA |
$ |
4,502 |
$ |
1,964 |
$ |
1,574 |
$ |
(1,628) |
$ |
6,412 |
|||||
|
For the six months ended June 30, 2018 |
|||||||||||||||
|
Amounts in thousands |
Canada |
United States |
Poland |
Corporate and Other |
Total |
||||||||||
|
Net earnings (loss) |
$ |
3,972 |
$ |
2,025 |
$ |
(246) |
$ |
(4,507) |
$ |
1,244 |
|||||
|
Interest expense (income), net |
1,959 |
— |
110 |
18 |
2,087 |
||||||||||
|
Income taxes (benefit) |
1,219 |
699 |
112 |
(1,037) |
993 |
||||||||||
|
Depreciation and amortization |
1,670 |
1,086 |
1,322 |
245 |
4,323 |
||||||||||
|
Net earnings (loss) attributable to non- |
328 |
— |
(124) |
(30) |
174 |
||||||||||
|
Non-cash stock-based compensation |
— |
— |
— |
347 |
347 |
||||||||||
|
(Gain) loss on foreign currency |
(138) |
— |
(181) |
70 |
(249) |
||||||||||
|
Loss on disposition of fixed assets |
3 |
1 |
858 |
1 |
863 |
||||||||||
|
Pre-opening expenses |
689 |
— |
405 |
350 |
1,444 |
||||||||||
|
Adjusted EBITDA |
$ |
9,702 |
$ |
3,811 |
$ |
2,256 |
$ |
(4,543) |
$ |
11,226 |
|||||
|
For the six months ended June 30, 2017 |
|||||||||||||||
|
Amounts in thousands |
Canada |
United States |
Poland |
Corporate and Other |
Total |
||||||||||
|
Net earnings (loss) |
$ |
3,306 |
$ |
1,553 |
$ |
1,518 |
$ |
(2,415) |
$ |
3,962 |
|||||
|
Interest expense (income), net |
1,785 |
— |
16 |
(12) |
1,789 |
||||||||||
|
Income taxes (benefit) |
1,324 |
951 |
612 |
(1,028) |
1,859 |
||||||||||
|
Depreciation and amortization |
1,648 |
1,228 |
1,044 |
183 |
4,103 |
||||||||||
|
Net earnings attributable to non- |
248 |
— |
760 |
— |
1,008 |
||||||||||
|
Non-cash stock-based compensation |
— |
— |
— |
235 |
235 |
||||||||||
|
Loss (gain) on foreign currency |
31 |
— |
(464) |
(52) |
(485) |
||||||||||
|
Loss on disposition of fixed assets |
11 |
— |
241 |
3 |
255 |
||||||||||
|
Acquisition costs |
28 |
— |
— |
152 |
180 |
||||||||||
|
Pre-opening expenses |
— |
— |
225 |
— |
225 |
||||||||||
|
Adjusted EBITDA |
$ |
8,381 |
$ |
3,732 |
$ |
3,952 |
$ |
(2,934) |
$ |
13,131 |
|||||
|
CENTURY CASINOS, INC. AND SUBSIDIARIES |
* The impact of foreign exchange rates is highly variable and difficult to predict. The Company uses a Constant Currency basis to show the impact from foreign exchange rates on current period revenue compared to prior period revenue using the prior period’s foreign exchange rates. In order to properly understand the underlying business trends and performance of the Company’s ongoing operations, management believes that investors may find it useful to consider the impact of excluding changes in foreign exchange rates from the Company’s net operating revenue, earnings from operations and net earnings (loss) attributable to Century Casinos, Inc. shareholders. Constant currency results are calculated by dividing the current quarter or year to date local currency segment results, excluding the local currency impact of foreign currency gains and losses, by the prior year’s average exchange rate for the quarter or year to date and comparing them to actual U.S. dollar results for the prior quarter or year to date. The average exchange rates for the current quarter and the prior year second quarter are reported in Item 1 of the Company’s Quarterly Report on Form 10-Q for the quarter ended June 30, 2018. Constant currency information is not a measure of financial performance under generally accepted accounting principles in the United States of America (GAAP) and should not be considered a substitute for net operating revenue, earnings from operations or net earnings attributable to Century Casinos, Inc. shareholders as determined in accordance with GAAP.
** The Company defines Adjusted EBITDA as net earnings (loss) attributable to Century Casinos, Inc. shareholders before interest expense (income), net, income taxes (benefit), depreciation, amortization, non-controlling interest net earnings (loss) and transactions, pre-opening expenses, acquisition costs, non-cash stock-based compensation charges, asset impairment costs, (gain) loss on disposition of fixed assets, discontinued operations, (gain) loss on foreign currency transactions and other, gain on business combination and certain other one-time items, such as acquisition and disposition costs and gain or loss. Intercompany transactions consisting primarily of management and royalty fees and interest, along with their related tax effects, are excluded from the presentation of net earnings (loss) and Adjusted EBITDA reported for each segment. Not all of the aforementioned items occur in each reporting period, but have been included in the definition based on historical activity. These adjustments have no effect on the consolidated results as reported under GAAP. Adjusted EBITDA is not considered a measure of performance recognized under GAAP. Management believes that Adjusted EBITDA is a valuable measure of the relative performance of the Company and its properties. The gaming industry commonly uses Adjusted EBITDA as a method of arriving at the economic value of a casino operation. Management uses Adjusted EBITDA to compare the relative operating performance of separate operating units by eliminating the above mentioned items associated with the varying levels of capital expenditures for infrastructure required to generate revenue and the often high cost of acquiring existing operations. Adjusted EBITDA is used by the Company’s lending institution to gauge operating performance. The Company’s computation of Adjusted EBITDA may be different from, and therefore may not be comparable to, similar measures used by other companies within the gaming industry. Please see the reconciliation of Adjusted EBITDA to net earnings (loss) attributable to Century Casinos, Inc. shareholders above.
*** The Company defines Adjusted EBITDA margin as Adjusted EBITDA divided by net operating revenue. Adjusted EBITDA margin is a non- GAAP measure. Management uses this margin as one of several measures to evaluate the efficiency of the Company’s casino operations.
|
CENTURY CASINOS, INC. AND SUBSIDIARIES |
About Century Casinos, Inc.:
Century Casinos, Inc. is an international casino entertainment company that operates worldwide. The Company owns and operates Century Casino & Hotels in Cripple Creek and Central City, Colorado, and in Edmonton, Alberta, Canada and the Century Casino in Calgary and St. Albert, Alberta, Canada and in Bath, England. Through its Austrian subsidiary, Century Resorts Management GmbH (“CRM”), formerly Century Casinos Europe GmbH, the Company holds a 66.6% ownership interest in Casinos Poland Ltd., the owner of eight casino licenses throughout Poland. Six of the casinos in Poland are operating as of August 8, 2018. The Company, through CRM, also holds 75% ownership interests in both CDR, which operates in the north metropolitan area of Calgary, Alberta, Canada, and Century Bets! Inc., which operates the pari-mutuel off-track horse betting network in southern Alberta, Canada. The Company holds a 51% ownership interest in Golden Hospitality Ltd., a company that manages a hotel and international entertainment and gaming club in Vietnam. The Company operates 13 ship-based casinos under agreements with four cruise ship owners. The Company, through CRM, also owns a 7.5% interest in, and provides consulting services to, Mendoza Central Entretenimientos S.A., a company that provides gaming-related services to Casino de Mendoza in Mendoza, Argentina. The Company is also developing Century Mile Racetrack and Casino in Edmonton, Alberta, Canada. The Company continues to pursue other international projects in various stages of development.
Century Casinos’ common stock trades on The Nasdaq Capital Market® under the symbol CNTY.
For more information about Century Casinos, visit our website at www.cnty.com.
|
CENTURY CASINOS, INC. AND SUBSIDIARIES |
This release may contain “forward-looking statements” within the meaning of Section 27A of the Securities Act of 1933, as amended, Section 21E of the Securities Exchange Act of 1934, as amended, and the Private Securities Litigation Reform Act of 1995. These statements are based on the beliefs and assumptions of the management of Century Casinos based on information currently available to management. Such forward-looking statements include, but are not limited to, statements regarding future results of operations, operating efficiencies, synergies and operational performance, the prospects for and timing and costs of new projects, projects in development and other opportunities, including the Century Mile, Bermuda and Vietnam projects, debt repayment, investments in joint ventures, outcomes of legal proceedings, changes in our tax provisions or exposure to additional income tax liabilities, and plans for our casinos and our Company. Such forward-looking statements are subject to risks, uncertainties and other factors that could cause actual results to differ materially from future results expressed or implied by such forward-looking statements. Important factors that could cause actual results to differ materially from the forward-looking statements include, among others, the risks described in the section entitled “Risk Factors” under Item 1A in our Annual Report on Form 10-K for the year ended December 31, 2017 and in subsequent periodic and current SEC filings we may make. Century Casinos disclaims any obligation to revise or update any forward-looking statement that may be made from time to time by it or on its behalf.


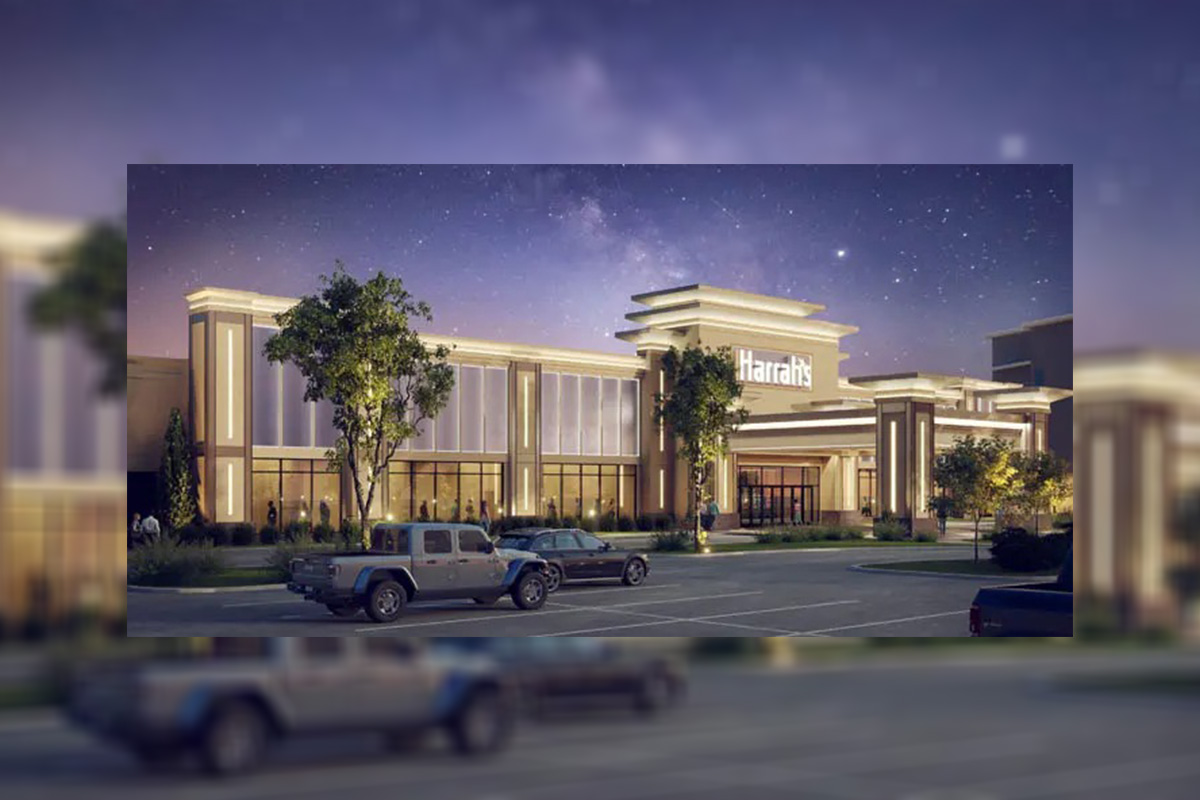
Nebraska’s first full-fledged, newly built and state-sanctioned gambling casino is slated to open in Columbus next month, marking a milestone in the state’s rollout of casino gambling.
The Nebraska Racing and Gaming Commission last Friday approved a target opening date of May 13 for Harrah’s Columbus.
“This is a big deal,” commission Chairman Dennis Lee said.
The state’s three other casinos are open, but in temporary facilities. According to construction schedules, all should be open by early next year.
“We’re definitely excited to open the first permanent casino in the state,” said Don Ostert, Harrah’s Columbus general manager.
The 17,000-square-foot casino floor will feature 400 slot machines and 11 live table games, including roulette and craps, Ostert said. It will feature a Brew Brothers restaurant and will offer Caesar’s sportsbook and racebook, Ostert said.
For racing fans, the complex will feature the state’s only 1-mile horse track, though racing isn’t scheduled to begin until August 16. By June, officials hope to have some horses out on the track to test the new surface.
Ostert said officials hope to draw customers from Norfolk and Grand Island, but also from Omaha and Lincoln.
Columbus Mayor James Bulkley said that, from the city’s standpoint, “we are very excited to see it get started and become part of the community.”
The developers incorporated some Columbus history into the casino, he said.
“The location where it is used to be called Wishbones, and it was a venue for years for entertainment, and so people recognize that name, and they have kept that name for the sports bar,” he said.
He expects the casino will draw from Omaha. Although driving to Columbus from downtown Omaha might take close to an hour and a half, the drive from west Omaha is more like an hour, he said.
“I can hit Elkhorn in a short hour today, which is now western Omaha,” he said.
In a few months, Omahans won’t have to leave town to visit a brand-new casino.
At Horsemen’s Park in Omaha, Warhorse Gaming officials are aiming to open their new casino in early August. It will open with 900 gaming positions, including table games and a Sweetwater Cafe.

Welcome to our weekly roundup of American gambling news again! Here, we are going through the weekly highlights of the American gambling industry which include the latest news and new partnerships. Read on and get updated.
Latest News
Caesars Entertainment announced that the Caesars Sportsbook Mississippi app is accepting mobile sports bets at Harrah’s Gulf Coast in Biloxi, Mississippi. Sports fans 21 and older who are interested in wagering on sports via mobile devices can download the Caesars Sportsbook Mississippi app to register and deposit statewide but must be physically present on-property at Harrah’s Gulf Coast to wager.
The Office of Lottery and Gaming (OLG) has announced that FanDuel’s sports betting app and website has officially launched. This development will introduce FanDuel’s sports wagering platform to District residents and visitors, completely replacing the current GambetDC sports betting app and website.
eCOGRA has been officially authorised by the Secretaria De Prêmios e Apostas (SPA) to operate as a certifying entity for betting systems, live gaming studios and online games in Brazil. This announcement marks a significant milestone as eCOGRA continues to extend its international offering of iGaming testing, inspection and certification (TIC) services in regulated markets across the globe.
Jennifer Shatley, a recognised expert in the field and a highly sought speaker and advisor, has joined the Responsible Online Gaming Association (ROGA) as Executive Director. Shatley has had 25+ years worth of experience, working closely with the treatment community, academics, researchers, government bodies, state councils and gaming industry representatives to promote responsible gaming.
Odditt, a leading provider of innovative sports betting data, tools and analytics, has appointed Elaine Milardo as its new Chief Technology Officer (CTO). With over 25 years of experience in the data industry and key roles at DraftKings and Vistaprint, Elaine brings a wealth of expertise to Odditt’s growing team.
Partnerships
Trustly, the global leader in Open Banking Payments, and Light & Wonder, the leading cross-platform global games company, are bringing cashless, in-person deposits to casino floors with Light & Wonder’s cashless solution, RAPIDPLAY. Building on Trustly’s success with guaranteed payments in online sports betting and iGaming, Trustly will deliver the same seamless, quick and secure online payment experience to the physical casino floor.
Fintech company Sightline has entered into an exclusive partnership with compliance and anti-fraud technology solutions leader GeoComply to bolster the security and efficiency of digital transactions within the regulated gaming industry. Sightline will integrate GeoComply’s cutting-edge IDComply identity verification solution as well as GeoComply’s compliance-grade geolocation tools across its comprehensive suite of digital payment solutions for land-based casinos and online gaming operators.
BetMGM has announced a partnership with GameCode, a distinguished iGaming company focused on the North American market. The partnership includes the launch of Boom Boom Boom, HammerCash, Gold Gold Gold and Super3 series which are now live at BetMGM in Michigan and New Jersey through direct integration. BetMGM plans to offer GameCode’s full portfolio of games in all jurisdictions where the operator’s iGaming platform is live pending regulatory approvals.
SCCG Management has announced a joint venture investment with Numb3rs, an innovative all-in-one payment solution provider built for gaming operators. The partnership aims to transform the gaming sector by integrating Numb3rs’ proprietary tech stack, ECRYPT, into the marketplace, thereby offering a comprehensive suite of payment processing solutions.

Welcome to our weekly roundup of American gambling news again! Here, we are going through the weekly highlights of the American gambling industry which include the latest news and new partnerships. Read on and get updated.
Latest News
FanDuel Group, the premier online gaming company in North America and an Official Partner of Churchill Downs Inc., announced five time Entertainer of the Year Luke Bryan and Grammy award-winning R&B singer Ne-Yo as the headlining performers at FanDuel’s inaugural Kentucky Derby Party. The exclusive, invite-only event will take place on Friday, May 3 at Paristown Arts and Entertainment District in Louisville, Kentucky from 7:00 PM to 12:00 AM.
TPI, a leading provider of innovative player communication solutions for the casino industry, has appointed Joe Tingson as its new Vice President of Customer Success. With his unparalleled dedication to his customers, Joe will play a pivotal role as a leader for our digital Customer Success and Product teams.
PrizePicks, the largest daily fantasy sports operator in North America, has announced plans for its new 33,000 square foot Atlanta Headquarters, which will be located in the Star Metals Building in Midtown Atlanta. The company plans to grow its workforce by 1000 new jobs over the next seven years, the economic impact of which will be $25M to the state of Georgia.
Century Casinos Inc. has announced that it opened its hotel in Cape Girardeau, Missouri, The Riverview. The Riverview is a 69 room, six-story building with 68,000 square feet that is adjacent to and connected with Century Casino Cape Girardeau. The project cost $30.5 million and was financed with cash on hand.
Churchill Downs Incorporated (CDI) has announced the opening of Terre Haute Casino Resort in Terre Haute, Indiana. The $290 million investment includes a casino floor with 1000 slot machines, 36 table games, and a state-of-the-art sportsbook. The 400,000-square-foot entertainment venue also features regionally inspired bars and restaurants including: Four Cornered Steakhouse, Rockwood Bar & Grill, The Soda Shoppe, Crossroads Center Bar and High Limit Bar.
Bragg Gaming Group Inc., a global B2B gaming technology and content provider, announced that Chief Financial Officer (CFO), Ronen Kannor, has notified Bragg’s board of directors (Board) that he will resign from his position to pursue other career opportunities, effective June 3, 2024. The Company confirms that the search for a replacement CFO has commenced.
Partnerships
EQL Games has partnered with global aggregation leader and NeoGames company, Pariplay, to provide the Virginia Lottery, through an agreement with NeoPollard Interactive, with a series of eInstant iLottery games for their industry-leading digital platform.
JACK Entertainment LLC announced the selection of Konami Gaming Inc.’s SYNKROS to power industry-leading systems technology across its 1.5 million square feet of casino entertainment space. The Ohio-based gaming operator’s portfolio includes a combined 2600+ gaming machines and 85 table games at JACK Cleveland Casino in downtown Cleveland, and at JACK Thistledown Racino, located approximately 10 miles to the southeast.
PrizePicks, the largest daily fantasy sports operator in North America, announced that the company has reunited with the Atlanta Braves as the club’s Official Daily Fantasy Sports Partner for the 2024 season. The partnership extends a longstanding relationship that dates back to 2020, with the two Atlanta-based companies continuing to work together on unique opportunities for their dedicated fans.


BOS agrees with KV’s/KO’s advertising assessment of “Trisskrapet” in TV4

Expanse Studios Launches in Bulgaria with Inbet

Week 17/2024 slot games releases

CasinoBeats Summit 2024: Providing the Tools to Balance Innovation and Regulation in the Digital Age

Aristocrat Leisure Completes Acquisition of Neo Group Ltd. (f/k/a NeoGames) for $29.50 per Share

Wazdan pounces for bigger wins in new sequel Mighty Wild™: Panther Grand Gold Edition

PRAGMATIC PLAY DELIVERS BRAND NEW DEDICATED LIVE STUDIO FOR BETSSON

Evoplay bolsters presence in Lithuania with Betsafe deal

SOFTSWISS Obtains Firstly Issued B2B Tobique Gaming Licence

VGCCC Fines Bookmaker MintBet $100,000 for Repeat Breaches of its Responsible Gambling Code of Conduct

BetGames Classic roulette launch w/ Andreas Koeberl, CEO

BGaming agrees LatAm content deal with Salsa Technology

Slotsjudge Awarded Best Affiliate in CEE at Prague Gaming & Tech Summit 2024

Gaming Americas Weekly Roundup – March 25-31

Gaming Corps makes key European addition with Fortuna Entertainment Group partnership

PRAGMATIC PLAY SLOTS LIVE WITH HOMMERSON CASINO IN THE NETHERLANDS
-

 Latest News5 days ago
THE UNIT APPOINTS ADAM NOBLE AS CHIEF COMMERCIAL OFFICER
-
Gaming5 days ago
The German Games Industry Association congratulates all winners of the German Computer Game Awards 2024
-
Baltics5 days ago
MARE BALTICUM Gaming & TECH Summit Announces Final Agenda for 2024 Event
-
Africa5 days ago
NE Group powers 888bets launch in Angola
-
Latest News5 days ago
INSPIRED LAUNCHES VIRTUAL SPORTS WITH COMEON GROUP
-
Industry News5 days ago
Wazdan set to gain more ground at Casino Beats Summit Malta
-
Central Europe5 days ago
Apparat Gaming and edict egaming announce partnership
-
Cryptocurrency5 days ago
Payhound empowers LSports with a seamless solution to receive payments


